Cavitation flow instability of liquid nitrogen in converging-diverging nozzle flow
Cryogenic fluids such as liquid hydrogen (20 K), liquid oxygen (90 K),
and liquid nitrogen (77 K) are expected for use in a variety of fields,
including as propellants for rockets and other aerospace equipment, and
refrigerant for superconducting equipment.
Research on cavitation has been carried out at many different facilities.
Most of this research, however, has used water and other liquids at room
temperature, and there are few detailed reports on cavitation in cryogenic
liquids because of the difficulties involved in designing appropriate experimental
equipment, and in conducting the experiments themselves.
Cavitation experiments were performed using converging-diverging (C-D)
nozzles with a throat diameter of 1.5 or 2.0 mm, and cavitation instability
mechanisms for liquid nitrogen under saturated and subcooled conditions
were investigated [28, 29]. Considering that throat flow velocity is limited by the speed of sound
in a single-component vapor-liquid two-phase flow, the relationship between
choked flow phenomena and cavitation behavior was firstly elucidated.
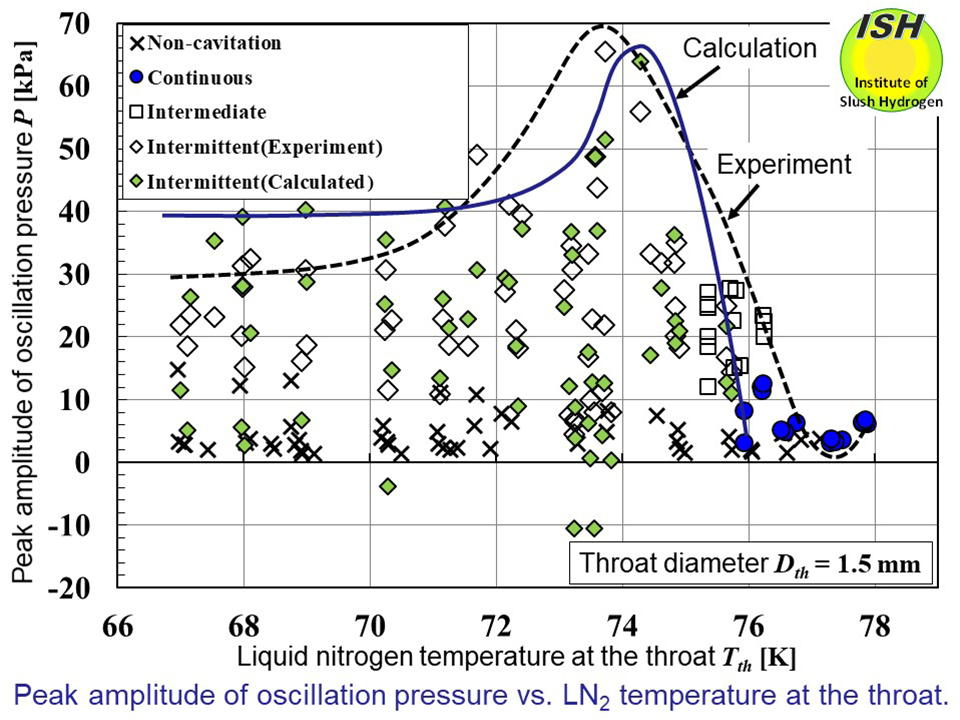
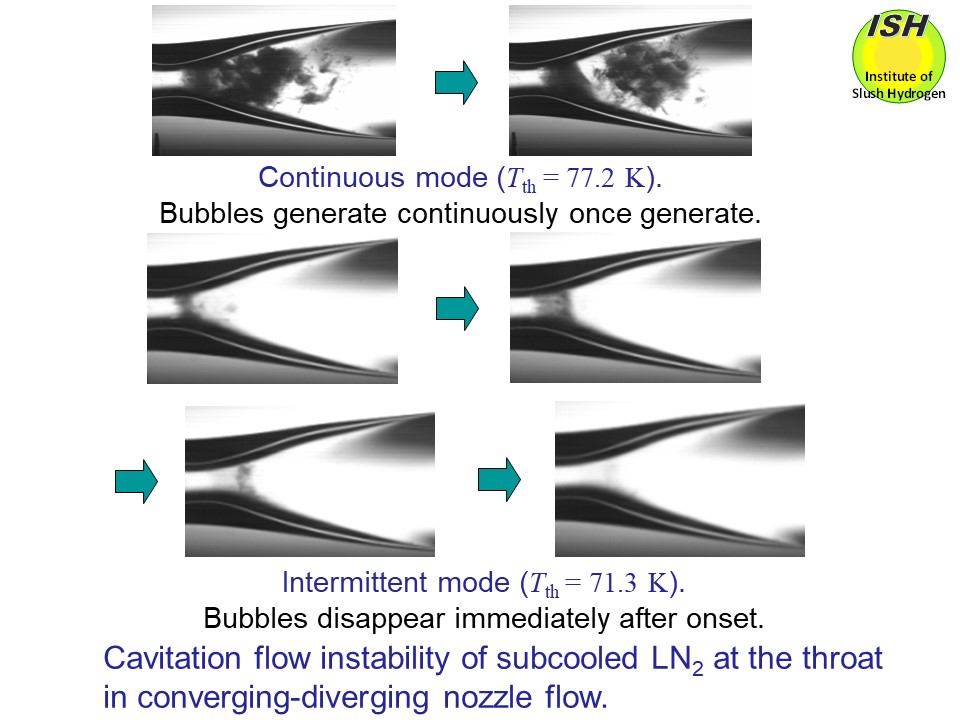
Cavitation was observed to change from continuous mode to intermittent
mode when the temperature of liquid nitrogen at the throat was reduced
to 76 K, as indicated in the above figure.
At a throat diameter of 1.5 mm, flows were observed that showed the intermittent
cavitation continuously occurring during a very short time-period. These flows were accompanied by a very high oscillation pressure of 70
kPa at a temperature of 74 K, as shown in the figure below.
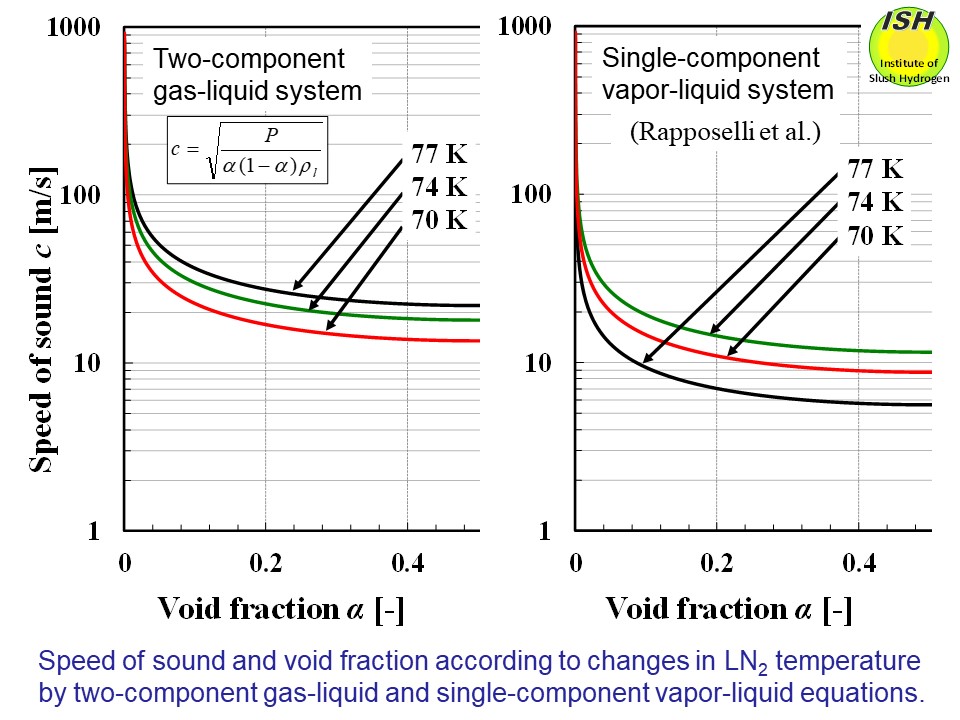
The speed of sound in a vapor–liquid two-phase flow is much lower than
that in a liquid. The figure below shows the relationships between the speed of sound and the void fraction
in a two-component gas–liquid two-phase fluid such as a mixture of air
and water, and between speed of sound and void fraction in a single-component
vapor–liquid two-phase fluid [32], where a nitrogen gas–liquid nitrogen
phase exist as a mixture. Changes in cavitation mode are thought to take
place because of the sharp slowdown in the speed of sound that occurs with
the shift to a vapor–liquid two-phase state when cavitation begins in the
liquid nitrogen. As shown in the figure below, even when the increase in
the void fraction is extremely small, the reduction in the speed of sound
is significantly greater than in a single-phase liquid. Compared with the
velocity before onset of cavitation, flow velocities at the throat after
the initiation of cavitation fall sharply. This is because the speed of
sound is much slower in a vapor–liquid two-phase flow, and this lowered
speed of sound limits flow at the throat. As the flow velocity falls, static
pressure at the throat rises above the saturation pressure, cavitation
cannot remain stable, and the flow returns to a single-phase liquid state.
First, we will look at the results using the speed of sound in a gas–liquid
two-phase flow in a two-component system. The relationships among throat
temperature, throat flow velocity, and cavitation mode are illustrated
in the figure below, which shows the results for throat diameters of 1.5 mm. Keeping in mind
that flow velocity at the throat is limited by the speed of sound, the
intersection of the incipient cavitation velocity and speed of sound curves
allows us to make a rough estimate of the maximum void fraction. We can
estimate the maximum void fractions to be 0.5 at 73 K, 0.2 at 71 K, and
0.1 at 68 K, indicating that the maximum void fractions decline as the
liquid temperature decreases. However, as shown in the figure below, the results of the high-speed video visualization confirm that the void
fraction at the intersection of the incipient cavitation velocity and the
speed of sound curves is much lower than that for the curves. Moreover,
the interference between the speed of sound and flow velocity observed
in the temperature region above 74 K cannot yet be fully explained.
Next, we will look at the results using the speed of sound in a vapor–liquid
two-phase flow in a one-component system. The figure below illustrates the relationships among throat temperature, throat flow velocity,
cavitation mode, and speed of sound. The curves for speed of sound indicate
void fractions of 0.03, 0.06, 0.09 and 0.12. Unlike the case in the two-component
system, keeping void fraction constant, each speed of sound curve reaches
a peak velocity at around 75 K. In the temperature range less than 74 K,
where intermittent cavitation was observed, the maximum void fractions
were estimated to be 0.12, 0.09, and 0.06 at temperatures of 74 K, 72 K,
and 70 K, respectively, demonstrating that the void fractions decrease
as the temperature becomes lower. This trend would tend to make it more
difficult for cavitation to occur at lower temperatures, and even if cavitation
did occur, the void fraction at the throat would be small in comparison
with that under high temperature conditions. This explanation is in good
agreement with the results of the visualization tests. As regards the speed of sound in a one-component vapor–liquid two-phase
flow, these findings confirm therefore that a choked flow phenomenon occurs
during cavitation and suppresses flow velocity at the nozzle throat, and
that this in turn causes a change in cavitation mode.
Oscillation pressure during cavitation reached its peak in the 74–76 K
temperature range (intermediate cavitation mode). In other words, during
cavitation in intermediate and intermittent modes, oscillation pressure
peaked at 30 kPa at around 76 K when the nozzle throat diameter was 1.5
mm, and at 40 kPa at around 74–76 K when the throat diameter was 2.0 mm.
In addition, even when the degree of subcooling (temperature) of liquid
nitrogen changes, the magnitude and trend of maximum oscillation pressures
can be estimated by measuring the difference in throat static pressure
immediately before and during cavitation. Moreover, at a throat diameter
of 1.5 mm, flows were observed that showed the intermittent cavitation
continuously occurring during a very short time-period. These flows were
accompanied by a very high oscillation pressure of 70 kPa at a temperature
of 74 K, and as shown in the figure below, it was found that the maximum oscillation pressure could be estimated
by examining the difference between the dynamic pressure of the throat
flow velocity at inception of cavitation and that at the time of measurement
of oscillation pressure.
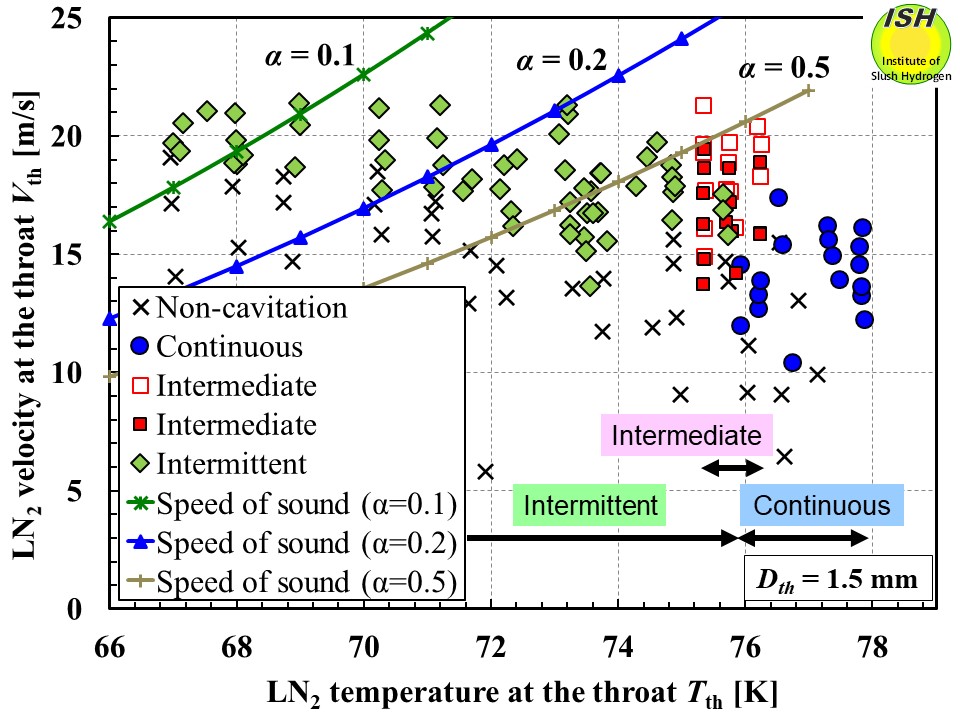
Liquid nitrogen temperature, velocity, speed of sound calculated by the two-component gas-liquid eq. and cavitation modes.
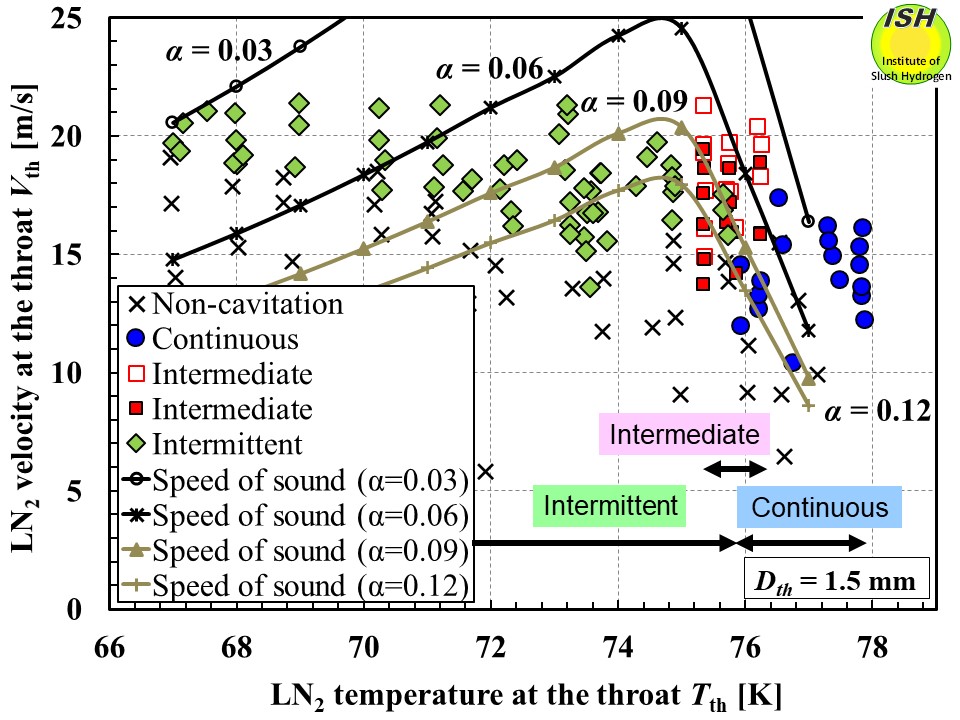
Liquid nitrogen temperature, velocity, speed of sound calculated by the single-component vapor-liquid eq. and cavitation modes.
Correlation between oscillation pressure and liquid nitrogen temperature at the throat