Flow and heat transfer in boiling nitrogen flow
The Japan Aerospace Exploration Agency (JAXA) is moving forward with the
development of the technology for hypersonic pre-cooled turbojet engines
that is fueled by liquid hydrogen. Because the liquid hydrogen is in a
forced convection boiling heat transfer state (vapor-liquid two-phase flow)
as it undergoes heat transfer with high-temperature air in the air pre-cooler
during high-speed flight, pressure drop and heat transfer performance are
important from a design standpoint.
As for our proposing high-efficiency hydrogen energy system, heat inleak
during pipeline transportation or heat generation induced by quenching
of superconducting equipment would cause liquid or slush hydrogen to a
forced convection boiling heat transfer state.
Accordingly, experimental studies of flow patterns, void fraction measurement,
pressure drop, and heat transfer were performed on boiling liquid nitrogen
flow with respect to circular pipe with an inner diameter of 10 or 15 mm,
square pipe with sides of 12 mm, and equilateral triangular and inverted
equilateral triangular pipes with sides of 20 mm, at each heat flux of
5, 10 or 20 kW/m2 [26, 27].
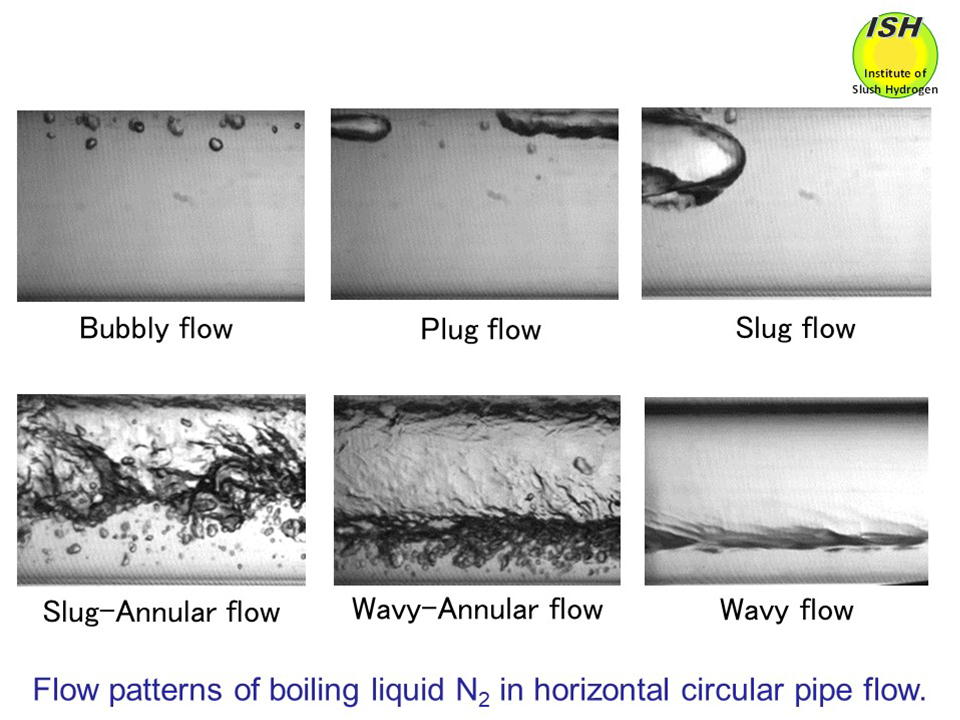
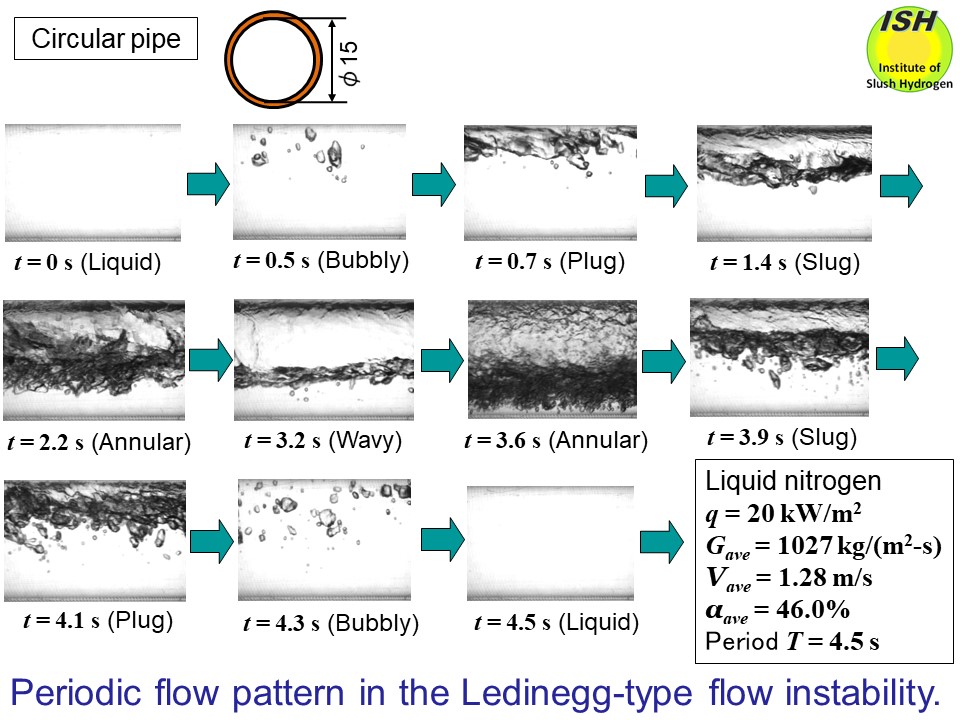
The above figure shows six flow patterns of bubbly, plug, slug, slug-annular, wavy-annular,
and wavy flows observed for a circular pipe with an inner diameter of 15
mm. Slug-annular flow, as suggested by the name, is a pattern incorporating
both slug and annular aspects.
Part of the work is carried out in collaboration with JAXA.
Experimentally obtained data were used in evaluation of the Winterton's
[34], Khalil's [35], Butterworth's [36], Chisholm's [44], Levy's [45],
Woldesemayat's [46] and Kadambi's [47] equations for pressure drop, respectively,
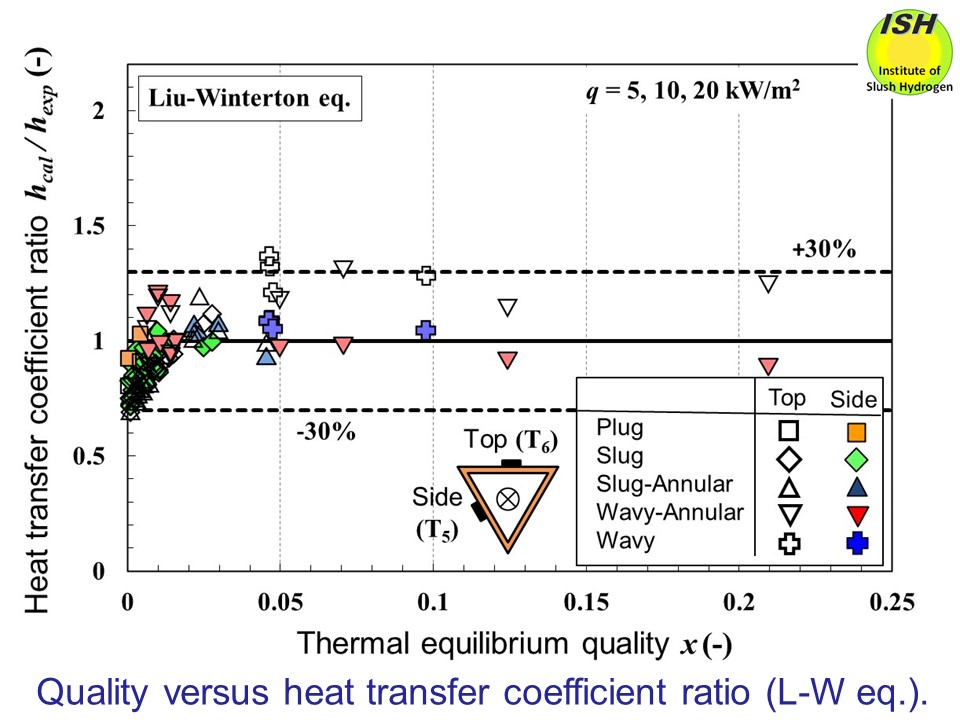
and evaluation of the Gungor-Winterton's [38], Liu-Winterton's [39], Schrock-Grossman's
[40], Chen's [41], Kandlikar's [48] and Steiner's [49] equations for heat
transfer coefficient, respectively.
The Ledinegg-type flow instability accompnied by the violent fluctuations of pressure drop and heat transfer
was experimentally investigated.
Pressure drop and heat transfer characteristics of boiling nitrogen in
horizontal square pipe flow
Pressure drop and heat transfer equations have been available using room
temperature fluids, such as water, primarily for flows in circular pipe.
However, empirical research on pressure drop and heat transfer in the cryogenic
boiling flow is insufficient with regards to
a) the applicability of the conventional equations to cryogenic fluids,
and
b) the applicability to pipe cross-sections that are not circular.
In the present study, boiling nitrogen two-phase flow patterns in a horizontal
square pipe were observed in terms of both visualization and void fraction
measurement. Based on the void fraction measurement results, comparison
was undertaken between experimental pressure drop results and analytical
(calculation) results using the conventionally proposed correlations between
void fraction and thermal equilibrium quality (referred to hereafter as
quality). Differences were also clarified between heat transfer coefficients
stemming from differences in quality and flow pattern, as well as differences
in heat transfer coefficients among the top, side and bottom of the heat
transfer pipe. Furthermore, evaluation was conducted on the models for
pressure drop and heat transfer [27].
The heat transfer pipe (straight) was made of phosphorus deoxidized copper,
with a side of 12 mm, a wall thickness of 1.5 mm and a heated length of
800 mm. Nichrome wire was wound around the outside of the pipe and affixed
using the Stycast. Two varieties of capacitance type void meters were used,
one having its flat plate electrodes vertically opposed (vertical type)
and the other having the electrodes horizontally opposed (horizontal type),
together with an LCR meter for void fraction measurement [12, 14]. Test
conditions were: run tank pressure Prt=0.1-0.15 MPa, mass flux G=70-2000 kg/m2-s and heat fluxes q=5, 10 and 20 kW/m2.
Six flow patterns were observed during experiments: bubbly, plug, slug,
slug-annular, wavy-annular and wavy flows. Slug-annular flow, as suggested
by the name, is a pattern incorporating both slug and annular aspects.
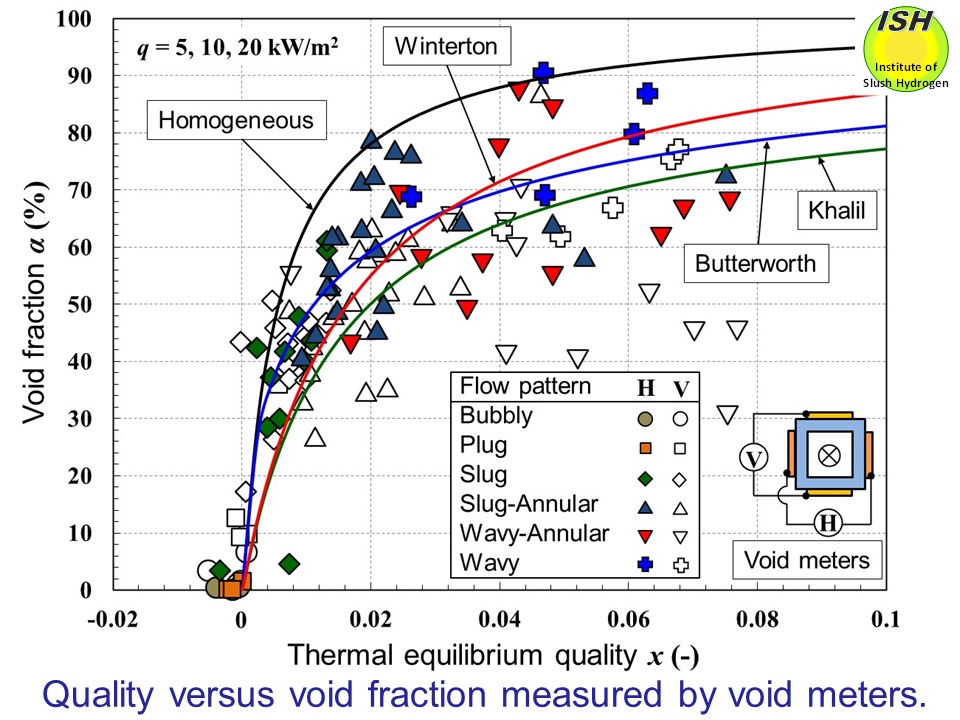
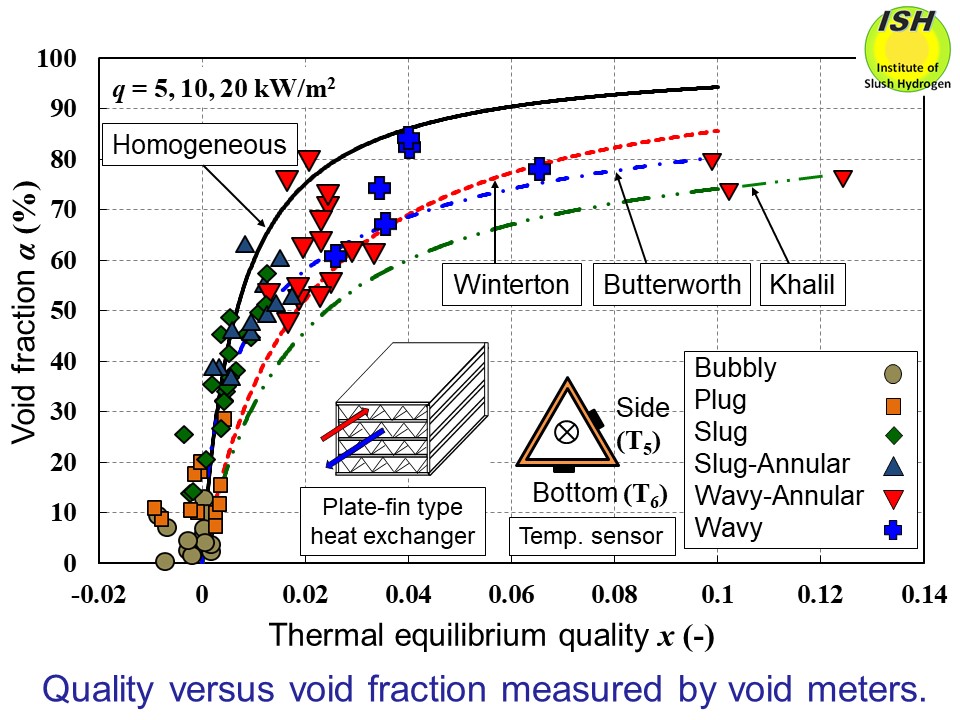
The relationship between the void fraction (as measured by void meters)
and quality is shown in the figure below. The solid lines are calculated values correspond to the homogeneous flow
model (slip ratio s=1), the separation flow models for slip ratios as proposed separately
by Winterton [34] and Khalil [35], and the Butterworth’s model [36]. The portion in which quality is negative is where subcooled boiling occurs. In
the region of high quality, the separation flow model tends to show better
agreement with the actual values than the homogeneous flow model. With respect to the vertical type (V) and horizontal type (H) void meters,
the latter provides more accurate measurement of the actual void fraction. In the case of circular pipe as well, analytical results have been reported
showing that a horizontal type void meter offers better measurement accuracy
[37].
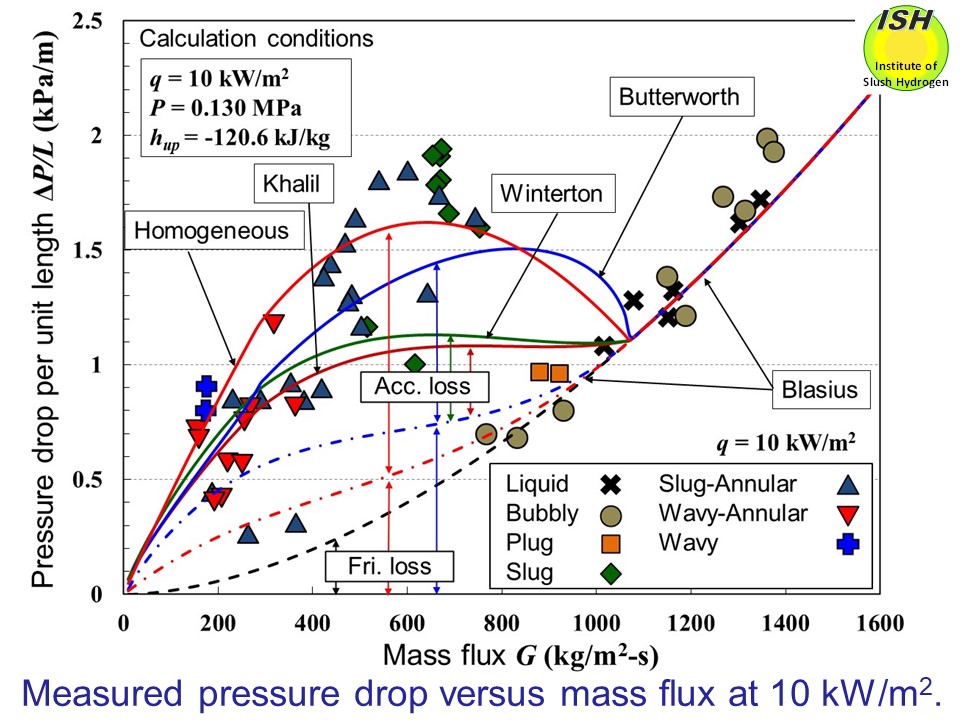
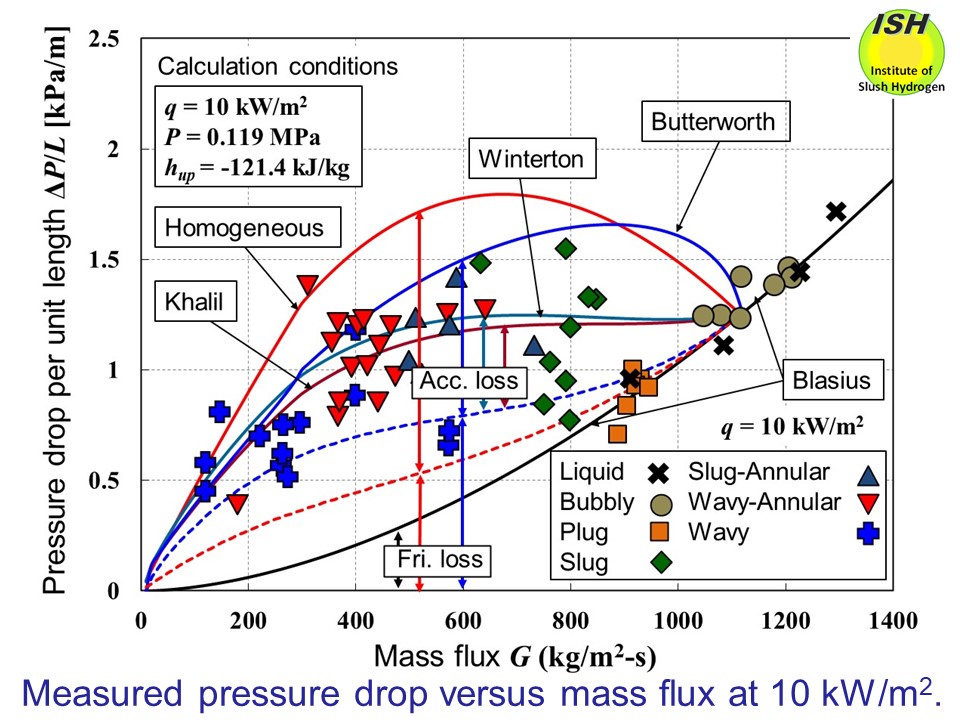
Pressure drop in a horizontal pipe is composed of acceleration loss and
friction loss. Using the homogeneous flow model (s=1), together with separation flow models that agree well with the void
fraction obtained from measurement results (i.e., Winterton, Khalil and
Butterworth) as illustrated in the figure below, pressure drop per unit length was calculated. The figure shows experimentally obtained pressure drop at heat flux of 10 kW/m2, together with total pressure drop, acceleration loss and friction loss
for the homogeneous flow and separation flow models, calculated at the
representative experimental conditions indicated in the figure. For reference,
the Blasius equation of pressure drop (friction loss) for the liquid nitrogen
flow is shown in the figure.
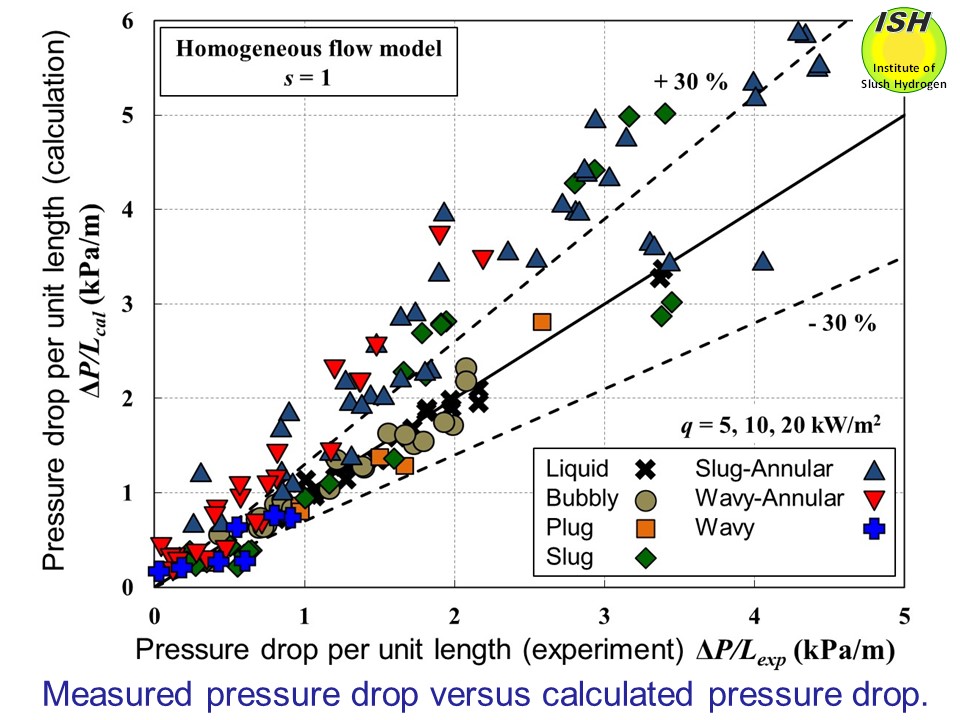
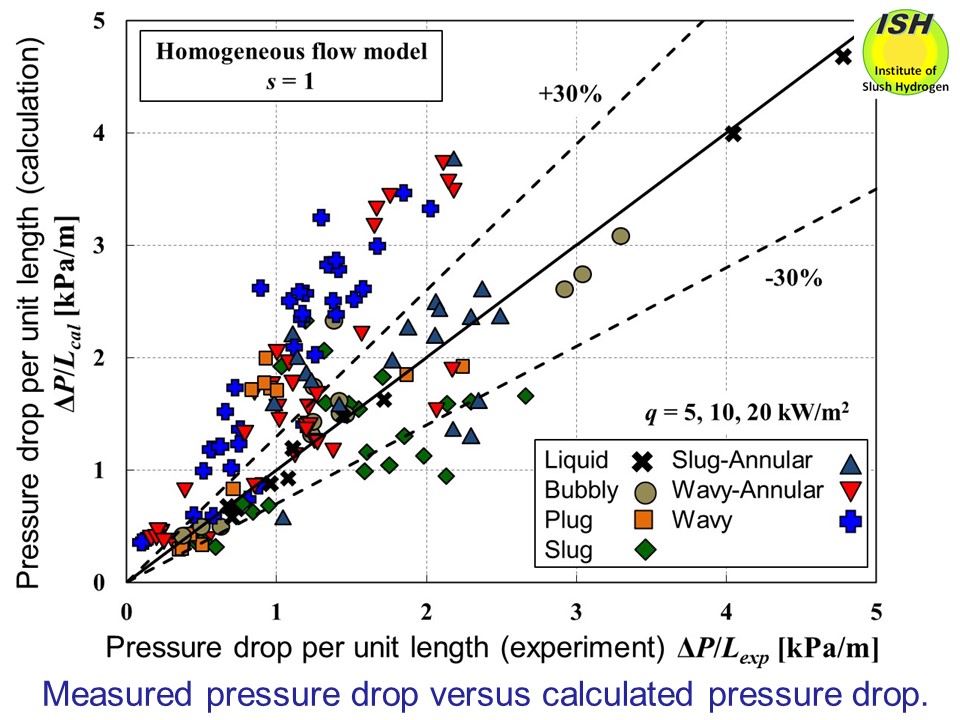
Two figures below indicate, respectively, calculated results obtained using the homogeneous
flow model and the Butterworth’s model, together with experimental results
obtained for pressure drop at heat fluxes of 5, 10 and 20 kW/m2. However, in the measurement interval where quality is negative or zero,
calculation is performed using the conventional Blasius equation. Here,
let us briefly compare the four types of models. While the homogeneous
flow model can be used to evaluate experimental results for low void fractions
(bubbly and plug), experimental values are overestimated by more than 30%
when pressure drop is large (high void fraction). Because the flow velocities
for the liquid and vapor phases are assumed to be the same in the homogeneous
flow model, the liquid phase velocity tends to be overestimated, leading
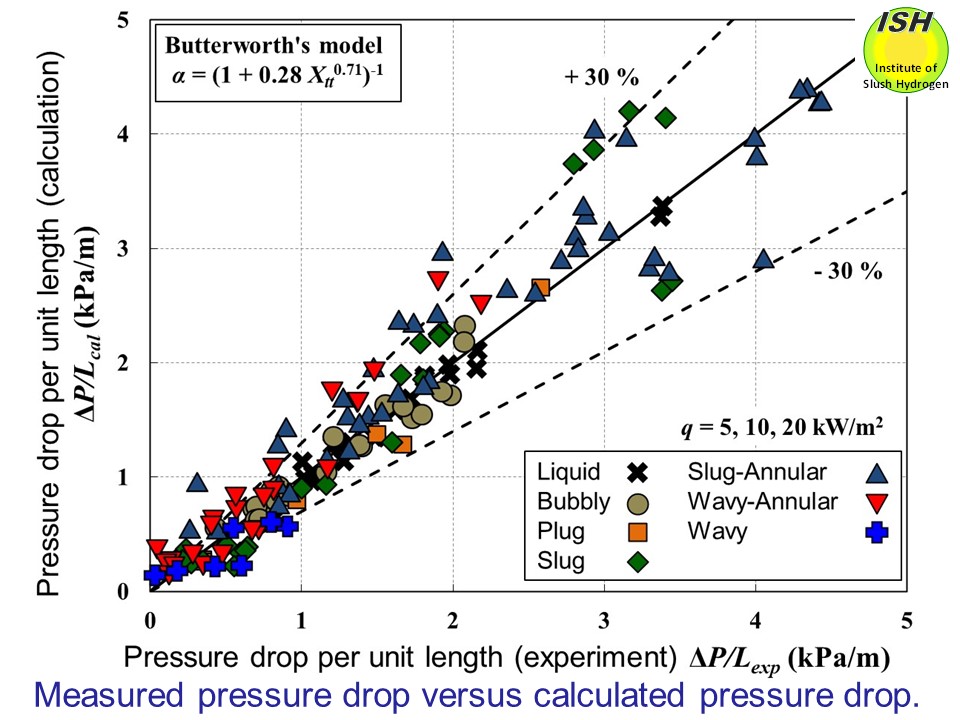
in turn to overestimation of pressure drop. The calculation results for
the Butterworth’s model, indicated in the figure, are within ±30% agreement
for most of the experimental results in nearly all of the flow patterns.
Considering the experimental and calculated values in terms of the absolute
average of deviation, the Butterworth’s model delivered better results.
The calculation results for the Winterton’s and Khalil’s slip ratios, which
are not shown in the present paper, also enabled evaluation within ±30%
of the experimental values in most cases, with the separation flow model
providing good agreement with the experimental results.
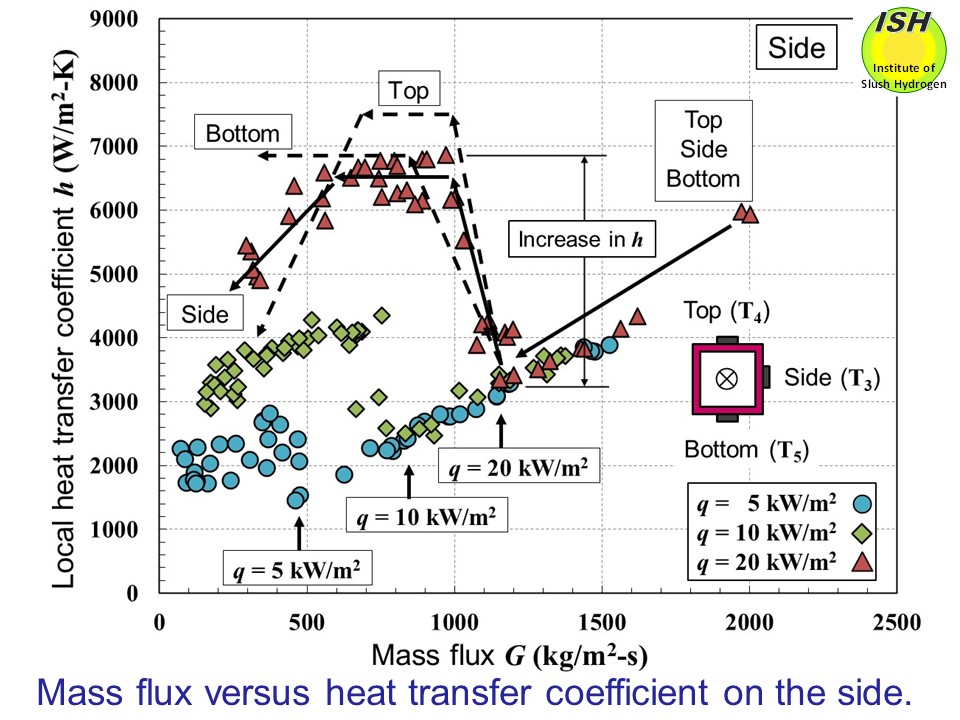
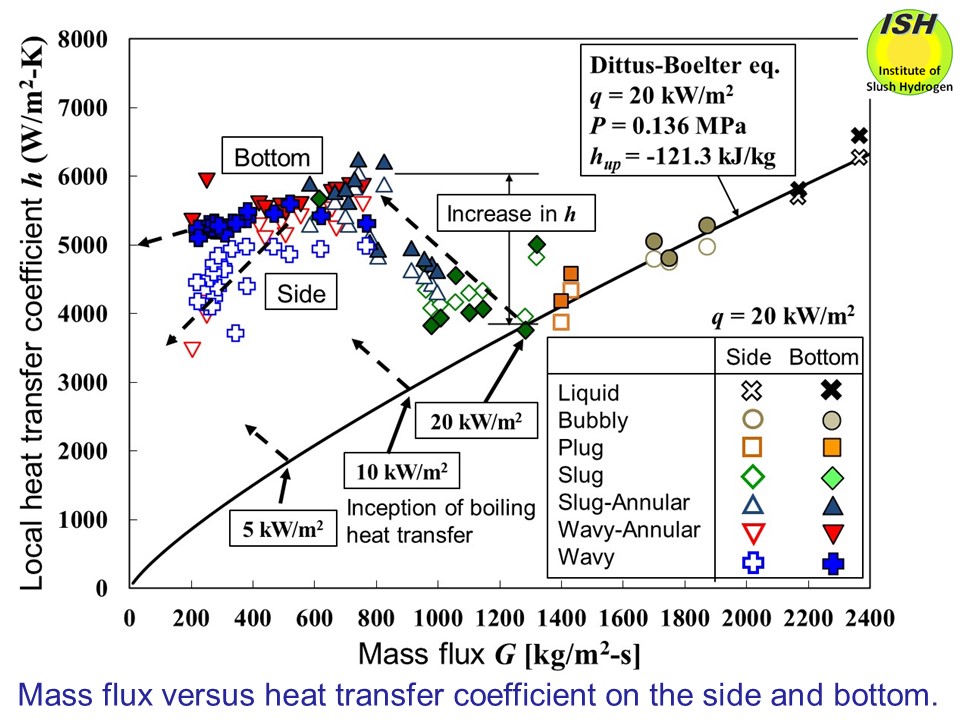
The heat transfer coefficients on the side of the square pipe for heat
fluxes of q=5, 10 and 20 kW/m2 are illustrated in the figure below. In the region where mass flux is large, forced convection heat transfer
in liquid phase is dominant; the heat transfer coefficient does not depend
on heat flux, depending instead on the magnitude of mass flux. The high
mass flux region is also characterized by almost no difference in terms
of heat transfer coefficient among the top, side and bottom of the pipe.
In the region of small mass flux, as designated by the arrows on the solid
lines in the figure, boiling commences and the heat transfer coefficient
increases when the mass flux becomes less. When the mass flux decreases
further, nucleate boiling heat transfer becomes dominant, and the heat
transfer coefficient increases up to a certain point. The point of mass
flux at which boiling commences (the value of q in the figure) becomes lower with reduced heat flux, while the amount
of increase in the heat transfer coefficient rises with greater heat flux.
In the figure, the nucleate boiling heat transfer coefficient for the
pipe side at heat flux of 20 kW/m2 is shown as a solid line, while the coefficients for the top and bottom
are indicated as broken lines. At the pipe bottom, following the rise in
the heat transfer coefficient to a certain level accompanying the reduction
in mass flux, this is maintained through the low mass flux region. Nucleate
boiling heat transfer becomes dominant; it is not dependent on the magnitude
of mass flux, but depends instead on the magnitude of heat flux, with the
heat transfer coefficient becoming constant. At the top of the pipe, while
the rise in the heat transfer coefficient accompanying the reduction in
mass flux exceeds that of the side or bottom, this falls off when the mass
flux continues to decline. That is, because the bubbles formed due to boiling
are concentrated in the flow at the top of the pipe, heat transfer is thus
promoted and the heat transfer coefficient rises. When mass flux falls
further, the wall surface is subject to dry-out, and the heat transfer
coefficient is reduced. The side exhibits similar behavior to the bottom,
but the heat transfer coefficient starts to decline when dry-out occurs.
Compared to the top, the liquid phase is present even in the low mass flux
region. Because nucleate boiling heat transfer is maintained, the mass
flux point where heat transfer coefficient decline starts to occur is low,
and the rate of decline is therefore gentle.
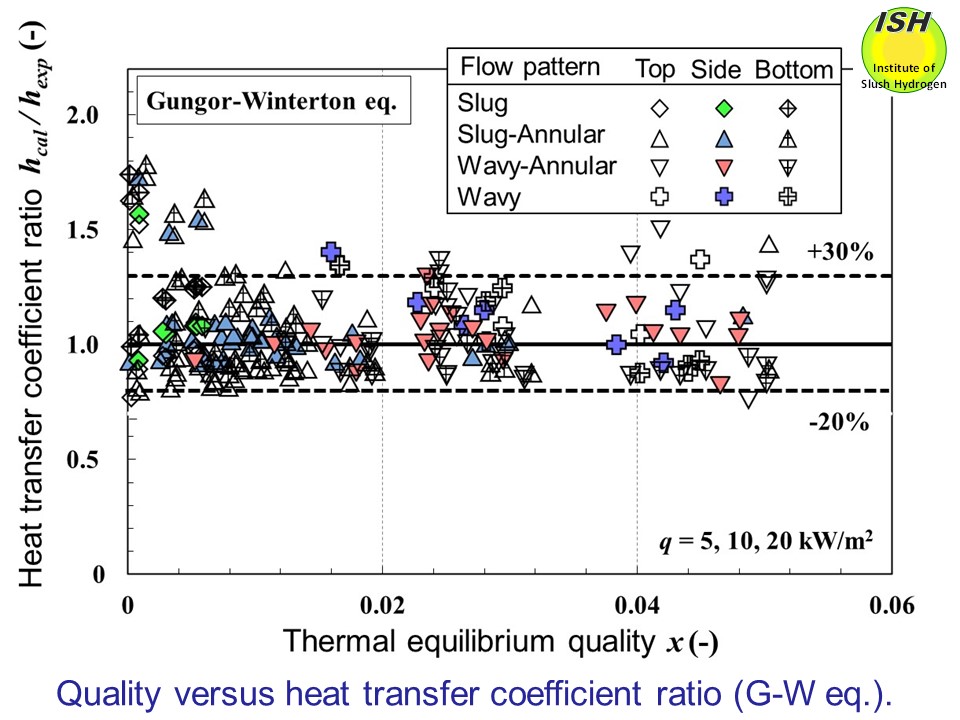
The heat transfer coefficients for the pipe top, side and bottom are evaluated
using the heat transfer correlations proposed for room temperature fluids.
The Gungor-Winterton and Liu-Winterton equations for vapor-liquid two phase
heat transfer are used. In the measurement point where quality is zero
or negative, the flow patterns observed are liquid single-phase, bubbly
and plug, and evaluation is possible to about ±20% using the Dittus-Boelter
equation, regardless of the circumferential location of measurement. In
the case of positive quality, the flow patterns observed with slug, annular
and wavy, and results are obtained as follows. Comparison with the Gungor-Winterton
equation is presented in the figure below. At quality larger than 0.006, evaluation is possible within -20 to +30%
for most of the experimental values, regardless of the circumferential
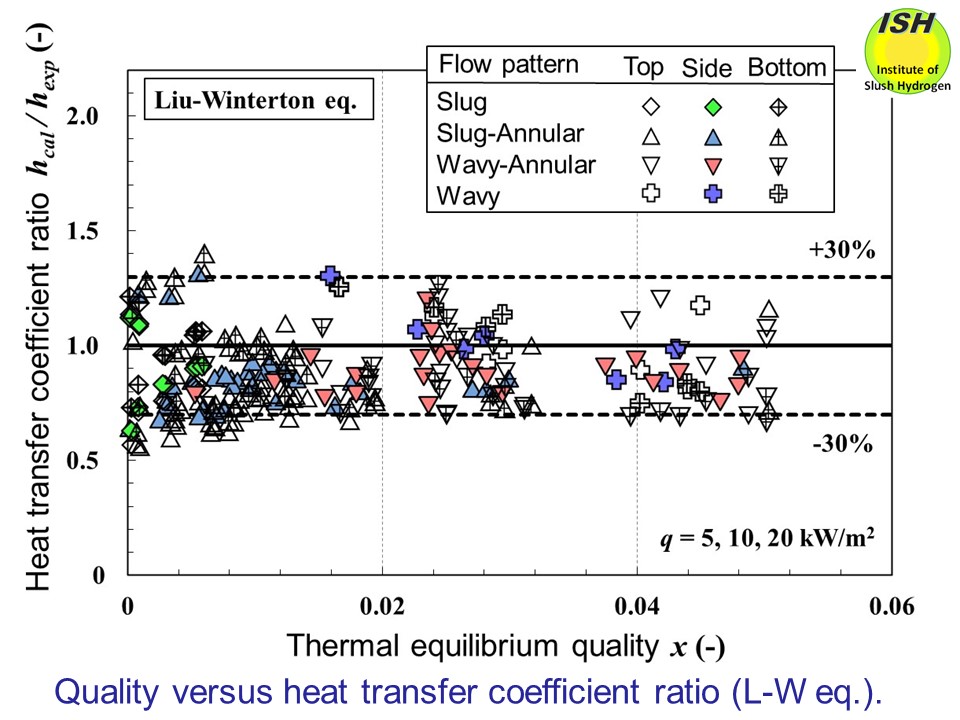
location of measurement. While the trend of the Liu-Winterton equation,
shown in the figure below, is to underestimate the experimental values as compared with the Gungor-Winterton
equation, the difference is small even in the region where quality is low,
such that evaluation was possible within ±30% for most of the experimental
values. In terms of the absolute average of deviation between the experimental
and calculated values, the Gungor-Winterton equation provided better agreement
with the experimental results.
Pressure drop and heat transfer characteristics of boiling nitrogen in
horizontal triangular pipe flow
As the practical development of high-temperature superconducting equipment
continues, the importance of liquid nitrogen as a refrigerant is expected
to increase substantially.
Future high-temperature superconducting equipment is expected to make
use of various cross-sectional configurations in refrigerant piping and
heat exchangers, pointing to the importance of the flow and heat transfer
characteristics of cryogenic fluids in piped flow. Compared with circular
pipe having the same hydraulic diameter, triangular pipe has greater heat
transfer surface area and superior integration, and is therefore used in
applications such as plate-fin heat exchangers.
Flow and heat transfer experiments were performed on boiling liquid nitrogen
flowing in a horizontal equilateral triangular pipe with sides of 20 mm.
Flow patterns were visualized, and measurements were taken of the void
fraction, pressure drop and heat transfer coefficient. Based on the void
fraction measurement results, and using conventionally proposed correlations
between void fraction and quality, comparisons were made between calculated
and experimentally obtained results for pressure drop, and the pressure
drop model is evaluated. Consideration was also given to differences in
heat transfer characteristics attributable to flow patterns, as well as
to heat transfer characteristics for the pipe sidewalls and bottom, used
in evaluation of the heat transfer model [43].
Using stycast, a nichrome wire heater was affixed to the triangular pipe (measuring 800 mm in length and 20 mm per side) made of
oxygen free copper. Pressure drop was measured along the heated length
of 550 mm; inner wall temperature was analytically calculated from the
outer wall temperature as measured at 6 points along the flow orientation,
while the local heat transfer coefficient was determined from the measured
bulk temperature. Local heat transfer coefficients were evaluated with
respect to the pipe sidewall (T5) and pipe bottom (T6). A double-helix type static capacitance void meter and a visualization
tube were positioned downstream from the heat transfer section. During
the experiments, the inlet pressure of heat transfer pipe was 0.11-0.15
MPa, mass flux G was 110-2370 kg/m2-s, and heat flux q was 5, 10, or 20 kW/m2.
Six types of flow patterns were observed, consisting of bubbly, plug,
slug, slug-annular, wavy-annular, and wavy.
The figure below illustrates the measured void fraction and the experimental results for
thermal equilibrium quality. Since the liquid nitrogen is in a slightly
subcooled state at the inlet of heat transfer pipe, subcooled boiling takes
place in the region of x< 0. In the pressure drop evaluation below,
given that the void fraction is required for estimation of acceleration
loss in the separated flow model, the correlation between void fraction
and quality has a major effect on the accuracy of the estimation. The figure
indicates the relationship between quality and the homogeneous flow model
(slip ratio s=1), the slip ratios proposed by Winterton and Khalil [37, 38] in the separated
flow model, and the void fraction used in the Butterworth model [39], respectively.
We have found in our previous experiment of the circular pipe that measurement
values obtained using the double-helix type void meter tend to be greater
than actually measured values, and as noted below, the pressure drop model
using the Khalil’s slip ratio shows good agreement with experimental results.
On the other hand, the homogeneous flow model overestimates the actual
void fraction.
Pressure drop in a horizontal pipe is composed of acceleration loss and
friction loss. Using the homogeneous flow model (s=1), together with separation flow models that agree well with the void
fraction obtained from measurement results (i.e., Winterton, Khalil and
Butterworth) as illustrated in the figure below, pressure drop per unit length is calculated. The figure shows experimentally
obtained pressure drop at heat flux of 10 kW/m2, together with total pressure drop, acceleration loss and friction loss
for the homogeneous flow and separation flow models, calculated at the
representative experimental conditions indicated in the figure. For reference,
the Blasius equation of pressure drop (friction loss) for the liquid nitrogen
flow is shown in the figure.
In the experiments, since the run tank is slightly pressurized, the quality
in the pressure drop measurement section can be negative (x < 0), positive (x > 0), or a mix of negative and positive. In the negative quality, the
Blasius equation shows over 50% less than experimental values when the
effect of subcooled boiling becomes substantial. Although not shown here,
when a modified Blasius equation taking the boiling number as a parameter
is employed, pressure drop during subcooled boiling could be predicted
to within ±20%. When the quality in the pressure drop measurement section
is calculated to be either positive or a mixed negative and positive, friction
loss is evaluated using the conventional Blasius equation for the subcooled
section (x < 0), while the previously noted 4 types of models (homogeneous, Winterton,
Khalil and Butterworth) are used to evaluate for the two-phase flow section
(x > 0).
Two figures below indicate, respectively, calculated results obtained using the homogeneous
flow model and Khalil's slip ratio, together with experimental results
obtained for pressure drop at heat fluxes of 5, 10 and 20 kW/m2. As a result of comparing the calculated and experimental values, it can
be seen in the figure that the Khalil's slip ratio shows good agreement
within about ±30%.

At the heat fluxes of 5, 10 and 20 kW/m2, when quality is negative at the measurement location of heat transfer
coefficient, the effect of subcooled boiling is substantial due to the
occurrence of bubbles. The conventional Dittus-Boelter equation shows over
30% less than experimental values for both the sidewall and bottom. As
with pressure drop, when a modified Dittus-Boelter equation taking the
boiling number as a parameter is employed, heat transfer coefficients could
be predicted to within ±15%.
The figure below indicates experimental results for mass flux G and heat transfer coefficient h at heat flux of 20 kW/m2. In the subcooled boiling, forced convection heat transfer in liquid phase
is governing, and the difference between the heat transfer coefficients
at the pipe sidewall and bottom is small. In the case of saturated two-phase
flow (x> 0, G< 1300 kg/m2-s) at the pipe bottom, accompanying reduced mass flux, the heat transfer
coefficient rises; then after reaching a constant value, a constant level
of heat transfer coefficient is maintained until the low mass flux region
is reached, subsequently falling off gently. At the sidewall, accompanying
reduced mass flux, given that nucleate boiling and the occurrence of bubbles
serve to promote heat transfer, the heat transfer coefficient increases
more than for the bottom. At even lower mass flux, wall surfaces dry out
and the heat transfer coefficient drops substantially.
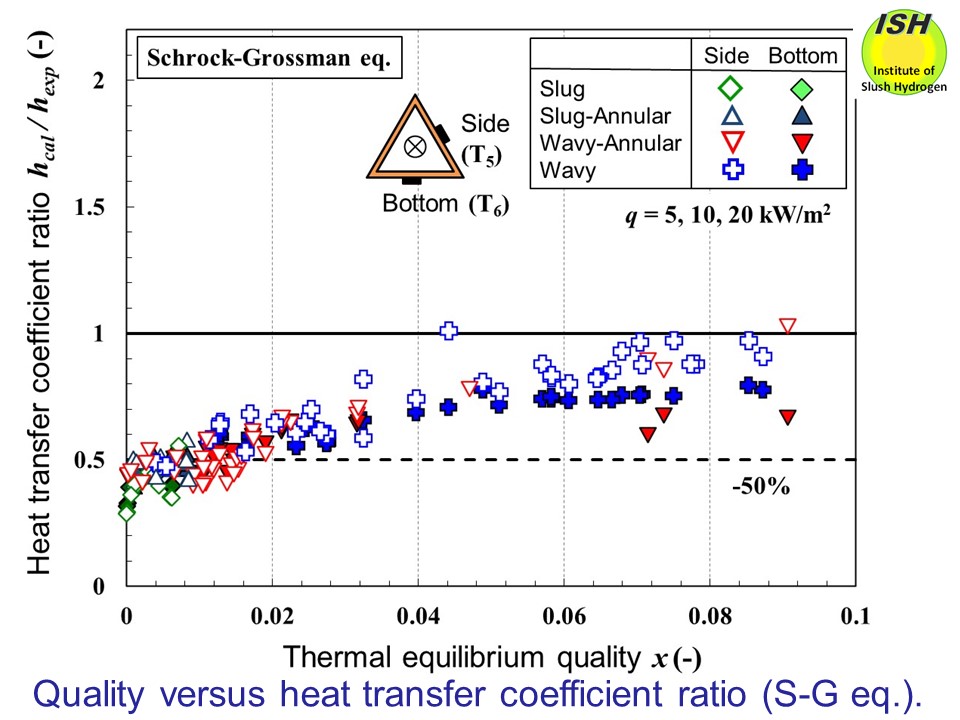
A quantitative comparison is undertaken between the heat transfer coefficients
measured at the sidewall and bottom on the one hand, and 4 types of heat
transfer correlation on the other (Schrock-Grossman [40], Chen [41], Gunger-Winterton
[38] and Liu-Winterton [39]).
For the Schrock-Grossman equation shown in the figure below, the calculated value is about 50% less than the experimental value in
region where quality is low (x < 0.02); when quality becomes larger, the value is in the range of
about 0-30% lower. When quality becomes even greater (x > 0.09), the calculated and experimental values are seen to be in good
agreement.
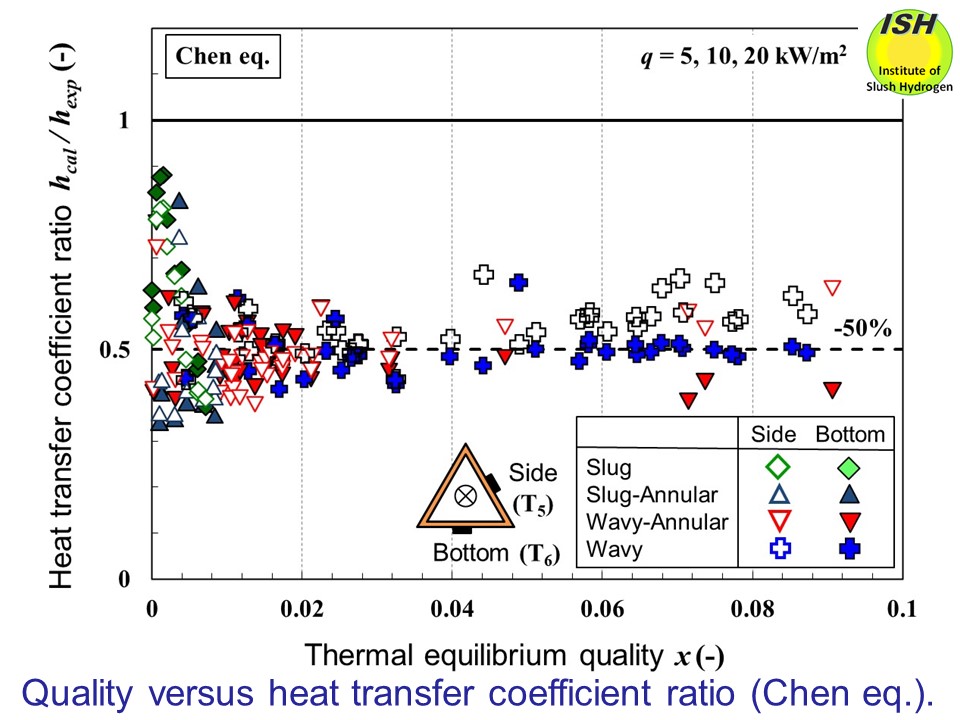
In the case of the Chen equation shown in the figure below, the calculated values are about 50% less than the experimental values
for all experimental quality levels (0 <x< 0.09). The Schrock-Grossman equation is a correlation intended for
water, while the Chen equation is intended for water, methanol, etc. Both
are based on experimental data obtained using vertical pipes, and, given
that the present experiments are conducted using a horizontal pipe, the
heat transfer pipe orientation is thought to be one reason why the experimental
data is underestimated. In the cases of the Schrock-Grossman and the Chen
equations, similar results are found in comparison with our experimental
work (q = 5, 10, and 20 kW/m2) undertaken using a horizontal circular pipe having an inner diameter
of 15 mm (0 < x < 0.07) [42] and a horizontal square pipe having a side width of 12
mm (0 < x < 0.055) [27].
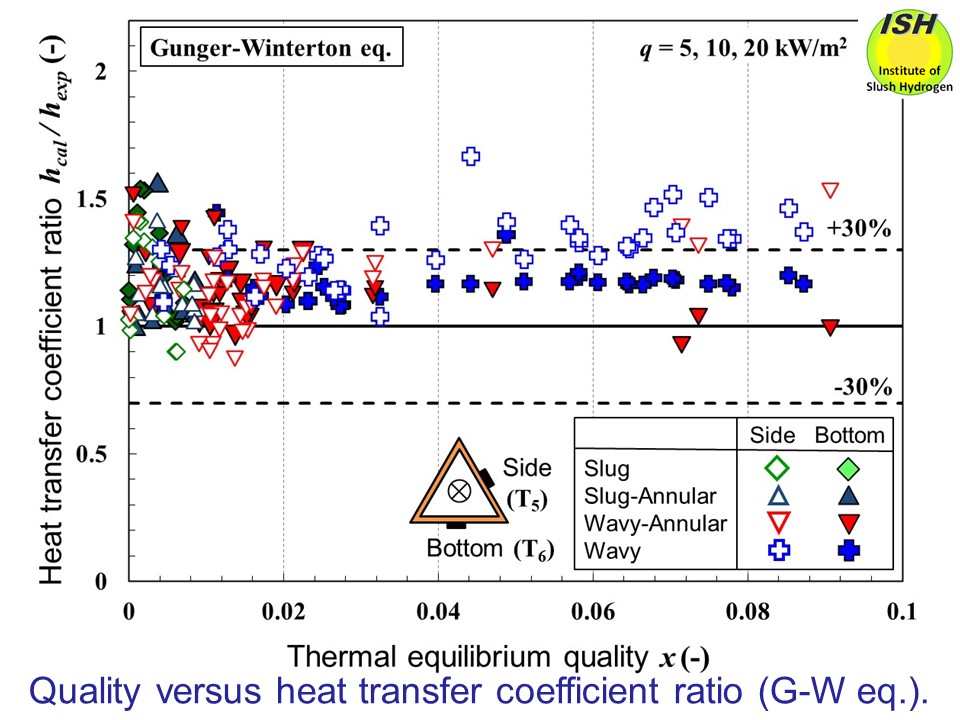
In the case of the Gunger-Winterton equation shown in the figure below, most of the pipe bottom heat transfer coefficients at quality of x > 0.006 could be evaluated in the range of 0-20%. On the pipe side
wall, as quality becomes greater (0.04 < x < 0.09) and wavy flow occurs, partial dry-out takes place at the wall
surface, and the experimentally obtained heat transfer coefficient becomes
lower. For this reason, the correlation overestimates the heat transfer
coefficient by about 30-50%.
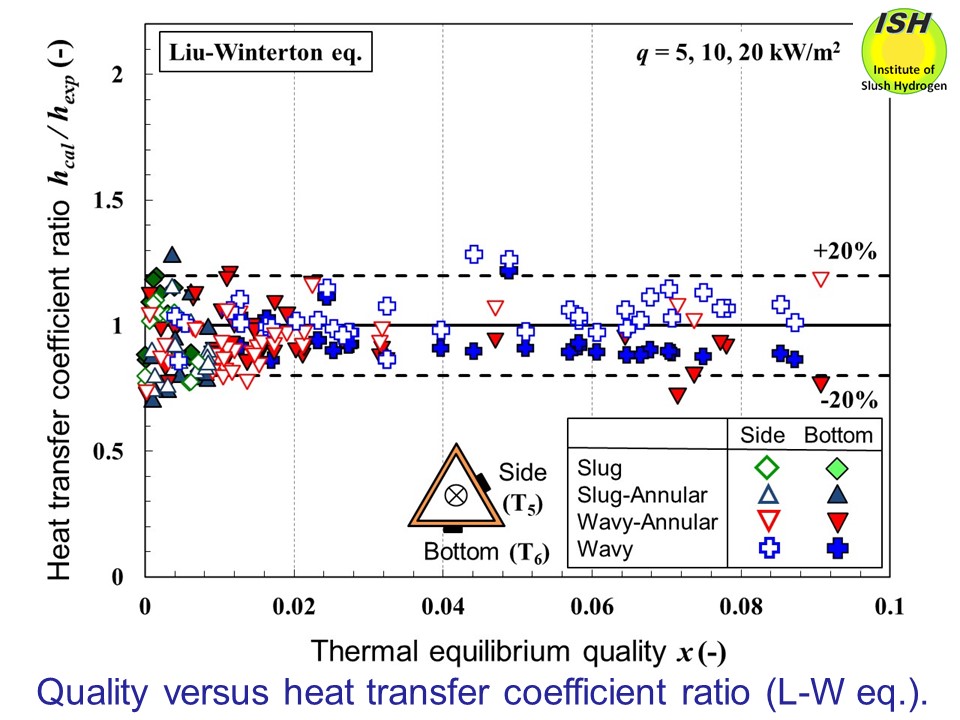
In the case of the Liu-Winterton equation shown in the figure below, although a tendency is found to underestimate the experimental values,
the difference becomes less in the region of low quality, and, across the
entire range of experimental quality (0 < x < 0.09), good agreement to within approx. ±20% is seen between the
calculated and experimental values. Also in terms of the absolute average
differential and standard differential, the Liu-Winterton equation exhibits
the best fit with the experimental values.
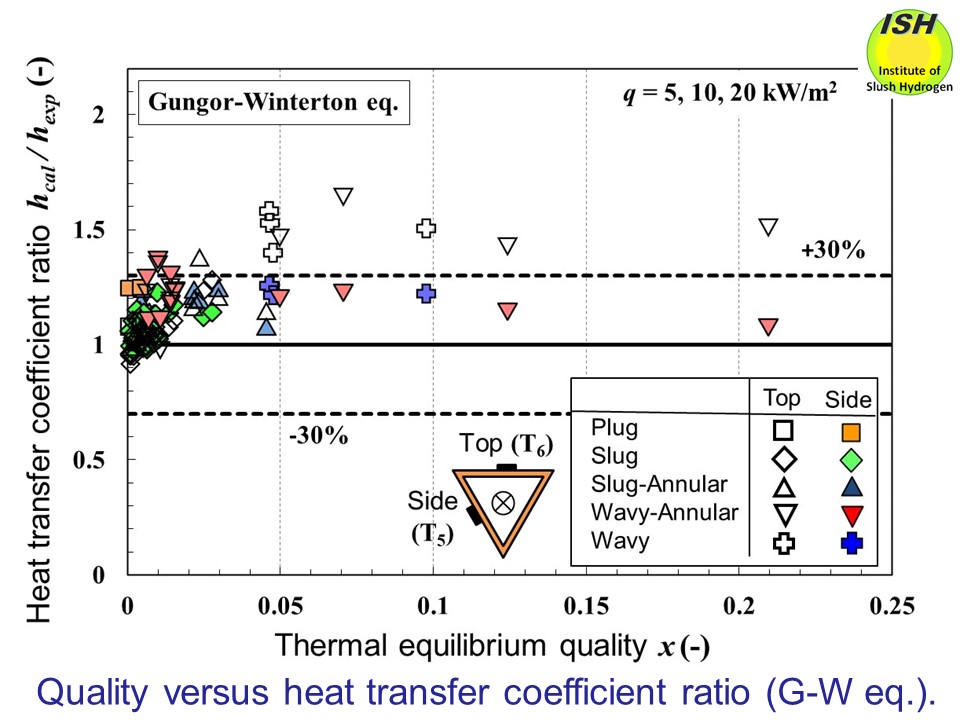
Pressure drop and heat transfer experiments were performed for a horizontal
inverted triangular pipe having the same cross section of the triangular
pipe. A quantitative comparison is undertaken between the heat transfer
coefficients measured at the sidewall and topwall on the one hand, and
2 types of heat transfer correlation on the other (Gunger-Winterton and
Liu-Winterton) as shown in the figures below. On the topwall, as quality becomes greater (x > 0.05) and the wavy flow occurs, partial dry-out takes place at the
wall surface, and the experimentally obtained heat transfer coefficient
becomes lower. For this reason, the correlation overestimates the heat
transfer coefficient.
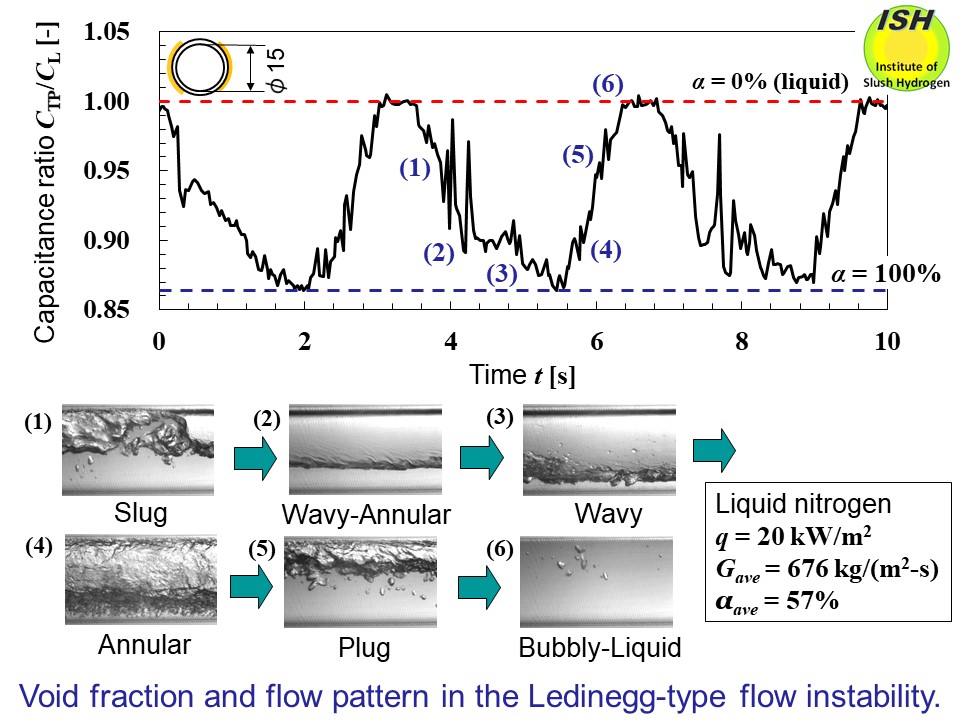
The Ledinegg-type flow instability in two-phase boiling nitrogen flow
The Ledinegg-type flow instabilityis caused by the negative slope of pressure drop vs. mass flux, (d(ΔP)/dG)
< 0, in the two-phase boiling flow inside a pipe.The above figureshows the periodic change of flow pattern in boiling liquid nitrogen flow
observed for a circular pipe with an inner diameter of 15 mm. The Ledinegg-type
flow instability in two-phase boiling flow is summarized in the figure below.
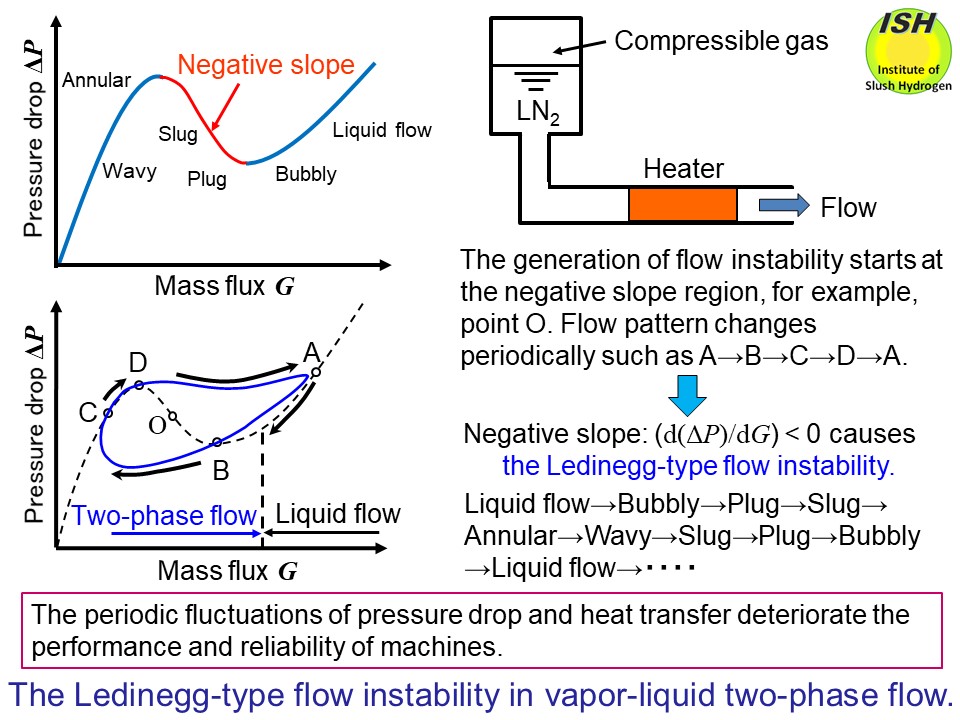
When the Ledinegg flow instability occurs, the periodic pressure drop
and heat transfer fluctuations continue violently, and deteriorate the
performance and reliability of machines seriously. The figure below shows the periodic changes of void fraction and flow pattern in boiling
liquid nitrogen flow for a circular pipe with an inner diameter of 15 mm.
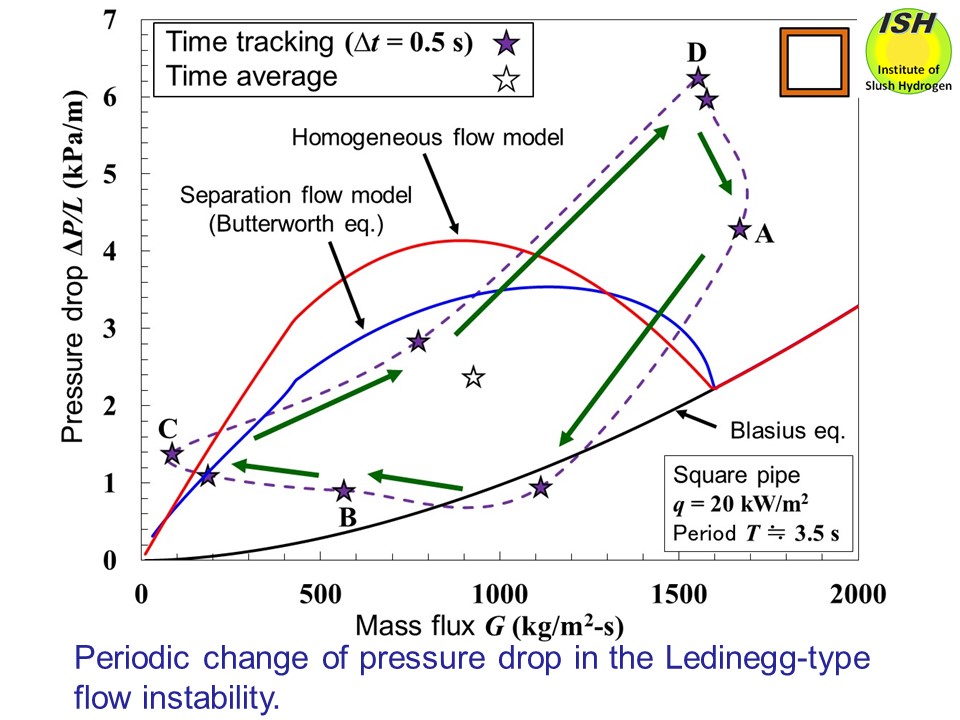
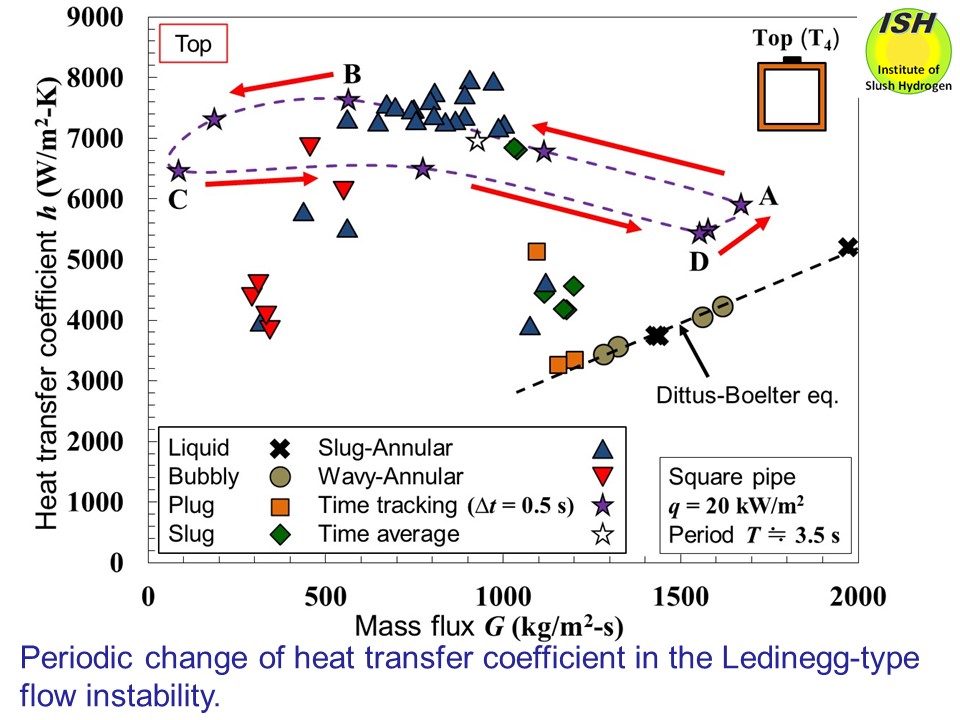
The periodic pressure drop and heat transfer fluctuations obtained in
the experiment of a horizontal square pipe with sides of 12 mm are illustrated
in the figures below. Similar results of the Ledinegg-type flow instability are found in our
experiments undertaken using a horizontal circular pipe with an inner diameter
of 15 mm, a horizontal equilateral triangular pipe with sides of 20 mm,
and a horizontal equilateral inverted triangular pipe with sides of 20
mm.