Pressure drop reduction, heat transfer deterioration, and numerical simulation (SLUSH-3D) of slush flow
In the transportation of slush hydrogen via pipeline, it is important
to consider pressure drop due to straight pipes, as well as flow restrictions
such as valves, converging-diverging pipes, and orifices. Such pipelines
also often make use of corrugated pipes to absorb the cryogenic contraction
(stainless-steel pipe contracts by approximately 3 mm per 1 m). Increased
pressure drop during slush hydrogen transport requires greater pump power,
thus reducing the overall performance of the transport system.
As indicated in “High-efficiency hydrogen energy system using slush hydrogen”,
if slush hydrogen is to be used as the refrigerant for high-temperature
superconducting (HTS) power transmission, heat generation can be anticipated
due to superconductor quench, making it important to also consider pressure
drop of slush hydrogen during heat transfer, together with forced convection
heat transfer to slush hydrogen.
Flow and heat transfer experiments were performed with respect to slush
nitrogen flow in a horizontal heat transfer pipe. From the experimental
results, we firstly reported in the world that the pressure drop reduction and heat
transfer deterioration (i.e., pressure drop and heat transfer coefficient
for slush nitrogen are less than those of liquid nitrogen) emerged simultaneously
during pipe flow, and the mechanisms involved in pressure drop reduction
and heat transfer deterioration have been elucidated.
The simultaneous occurrence of pressure drop reduction and heat transfer
deterioration shows "the Reynolds' analogy" holds in the case
of slush nitrogen flow, too.
From our previous research results, it was found that in the pseudo-homogeneous
flow of slush nitrogen (63 K) in horizontal circular pipes having diameters
of 10 mm and 15 mm, at flow velocities of over 2.0 m/s and over 3.6 m/s,
the maximum reductions in pressure drop were 25% and 23%, respectively,
in comparison with liquid nitrogen (63 K). Also, we have reported that
at heat flux of 10 kW/m2, the maximum pressure drop reductions were 23% and 17%, while at the same
time the maximum deteriorations in heat transfer coefficient were 27% and
20% [5, 17, 18].
In the case of a horizontal square pipe having sides of 12 mm, at a flow
velocity of over 2.5 m/s, the reduction in pressure drop was a maximum
of 12% as compared to liquid nitrogen; at heat flux of 10 kW/m2, the maximum pressure drop reduction was 12%, while at the same time heat
transfer coefficient deterioration was a maximum of 16% [19].
In the case of an equilateral horizontal triangular pipe with each side
of 20 mm (hydraulic diameter D = 11.55 mm) under the conditions of three different cross-sectional orientations,
at flow velocities exceeding 1.3-1.8 m/s, the pressure drop reduction was
a maximum of 16-19% in comparison with liquid nitrogen, regardless of heating.
Heat transfer deterioration was seen at flow velocities exceeding 1.2-1.8
m/s for a maximum of 13-16% [5, 20].
In a converging-diverging pipe with an inner diameter of 15 mm, at a flow
velocity of over 1.5 m/s, the maximum pressure drop reduction was 50% in
comparison with liquid nitrogen.
Considering corrugated pipe with inner diameters of 12 mm and 15 mm, at
flow velocity of over 2.0 m/s, the maximum pressure drop reductions were
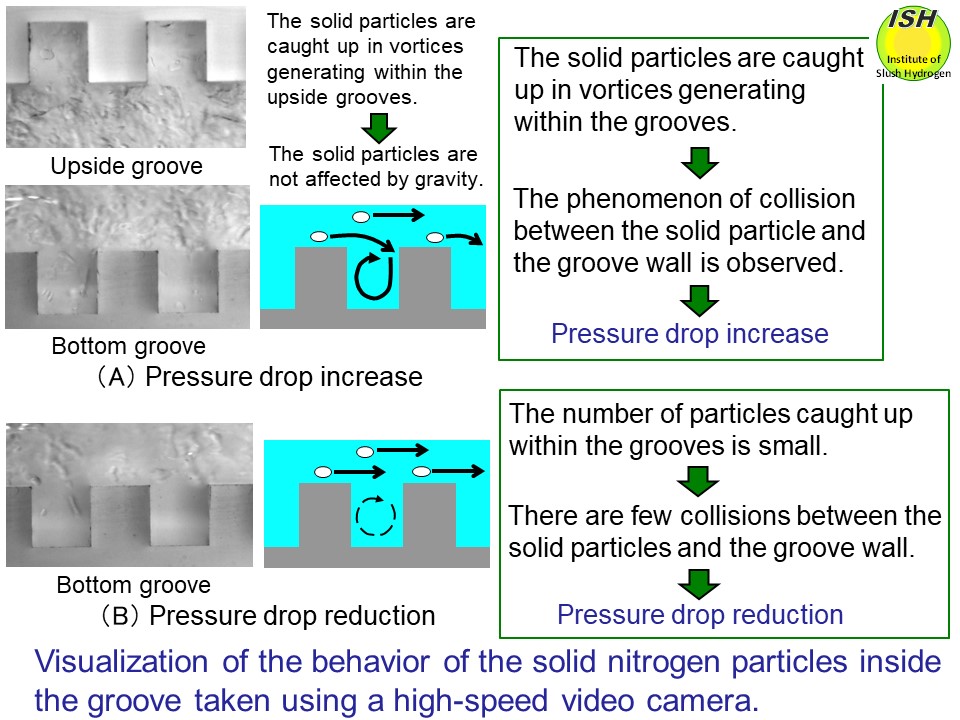
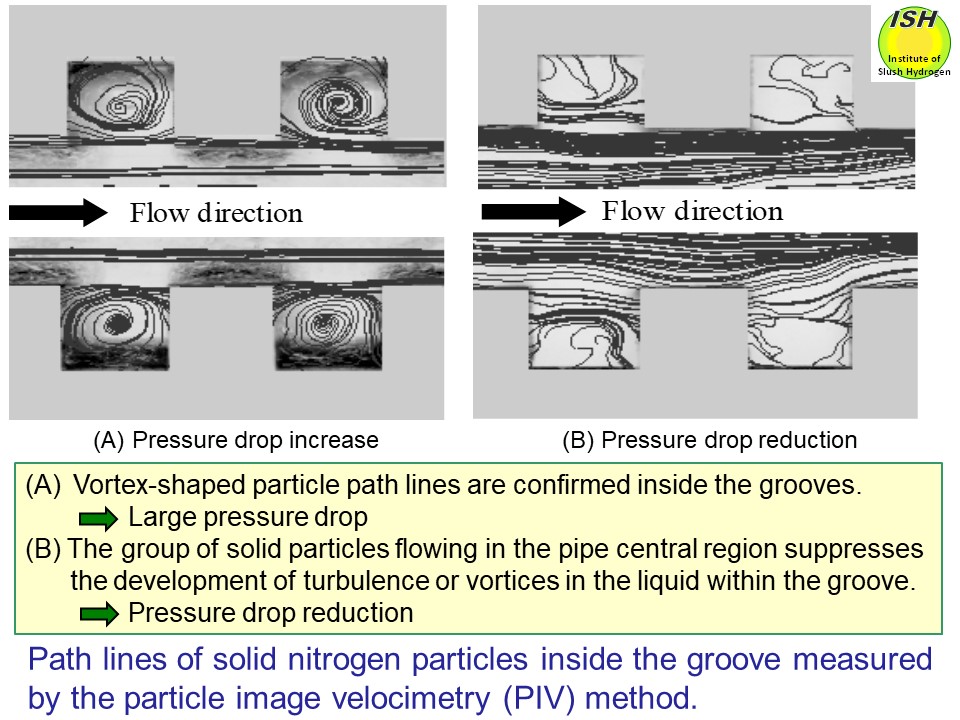
37% and 31%, respectively, as compared to liquid nitrogen. To clarify the mechanism involved in pressure drop reduction, the solid
nitrogen particles inside the transparent grooved rectangular pipe to simulate
corrugated pipe were visualized using a high-speed video camera, and the
path lines of solid nitrogen particles were measured using the PIV measurement
method*, respectively, as shown in the figures below [4, 21].
In an elbow having an inner diameter of 15 mm, at a flow velocity of 2.0
m/s, the maximum pressure drop reduction was 10% [22].
The mechanism involved in pressure drop reduction and heat transfer deterioration
is summarized as follows:
When pipe flow velocity increases and heterogeneous flow changes to pseudo-homogeneous
flow, such that the solid particles move towards the center of the pipe,
(refer to the upper left figure in the figure below), interference decreases
between the solid particles and the pipe wall. Here, the pipe center refers
to the region inside the pipe excluding the thin liquid layer near the
pipe wall in which there are few solid particles. This movement of solid
particles to the center results in a grouping of particles that suppresses
the development of turbulence at the pipe wall, thus resulting in pressure
drop reduction. Although heat transfer takes place near the pipe wall where
the liquid layer contains few solid particles, the comparative lack of
turbulence in this region means that the heated liquid near the wall is
prevented from dispersing towards the pipe center, causing heat transfer
deterioration.
When a slush fluid is subjected to pumped transport over a long distance
in combination with superconducting electrical power transmission, pressure
drop reduction and heat transfer deterioration are extremely important
from the standpoint of design data required to reduce the required power
for pumps and to prevent quench propagation.
In other research on pressure drop reduction in slush fluid, only one
experimental result obtained by Sindt et al. has been reported indicating
the occurrence of this phenomenon in slush hydrogen flowing in a circular
pipe having an inner diameter of 16.6 mm [30]. Only the pressure drop of
slush hydrogen was measured, and there was no attempt to explain the reduction
or to consider the heat transfer properties.
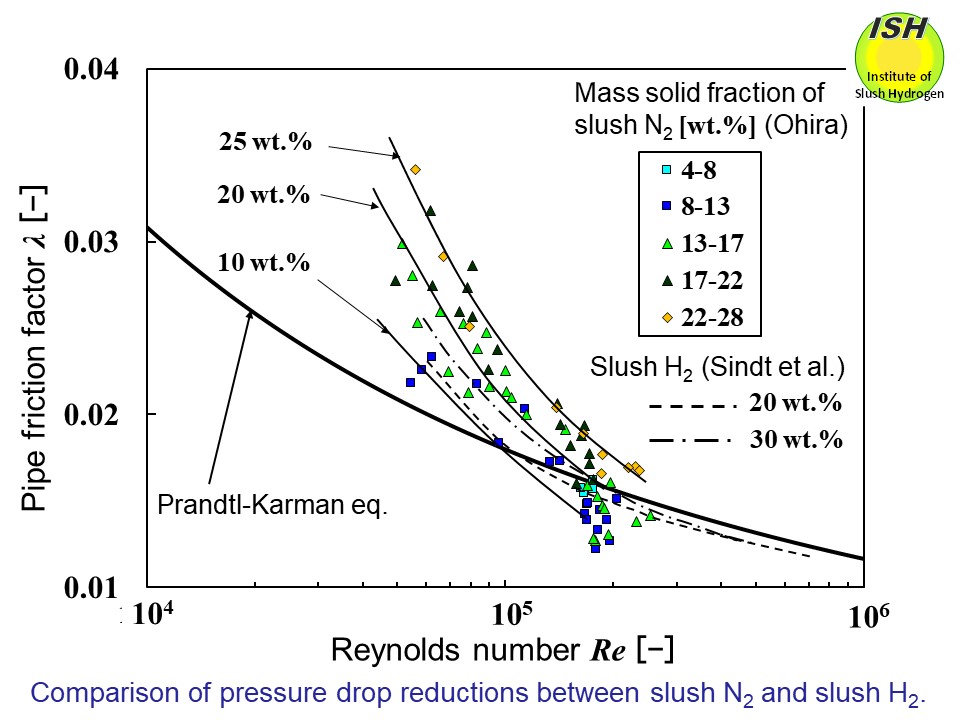
The relationship between the Reynolds number and the pipe friction factor
for slush nitrogen flowing in a circular pipe with an inner diameter of
15 mm and slush hydrogen is shown in the above figure. The solid line indicates
the Prandtl-Karman eq. for a single-phase liquid.
Pressure drop reductions for slush hydrogen and slush nitrogen appear
for the Reynolds (Re) numbers of 1.0×10⁵ and above, and as the solid fraction increases, the Re number at the onset of pressure drop reduction becomes greater.
However, the velocity at which pressure drop reduction initiated with
respect to slush hydrogen for an inner diameter of 16.6 mm was lower than
that in the case of slush nitrogen for a 15 mm diameter pipe (nearly the
same diameter) at identical solid fractions. That is, as indicated in the
figure, for a solid fraction of 20 wt.%, the Re number at which the reduction initiates is 1.0×10⁵ for slush hydrogen and 1.5×10⁵ for slush nitrogen. Since the kinetic viscosities are about the same for
both, the reduction initiates at lower flow velocity in the case of slush hydrogen. The solid-liquid density ratio is lower for slush hydrogen (1.12 vs. 1.18
for slush nitrogen), and, as the viscosity of liquid hydrogen is 1/11 that
of liquid nitrogen, pseudo-homogeneous flow occurs at lower flow velocity.
These results suggest that the pressure drop reduction effect is manifested
in pseudo-homogeneous flow.
Since two-dimensional numerical analyses cannot elucidate the complex
phenomena in slush flow such as the pressure drop reduction and heat transfer
deterioration at all, we developed the three-dimensional numerical analysis
code (SLUSH-3D) and utilized it for unheated slush nitrogen to consider
the distributions of mass solid fraction for a circular pipe, the secondary
flow velocity of the second kind of solid particles for an equilateral
triangular pipe and a square pipe [33], and the turbulent energy for a
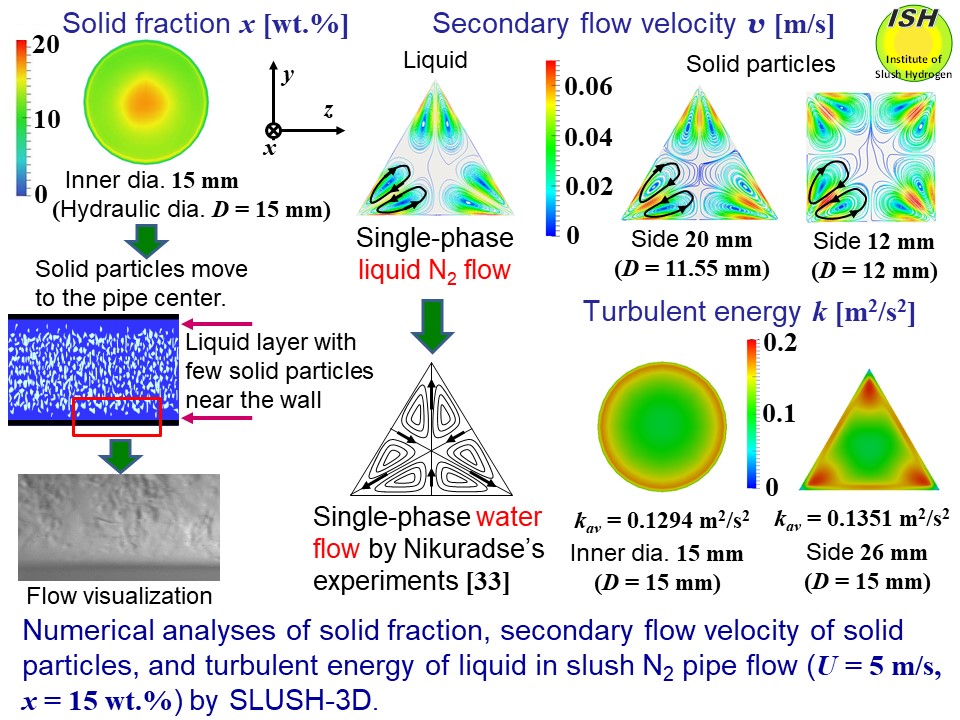
circular pipe and an equilateral triangular pipe. The conditions of calculation were flow velocity U = 5 m/s, average solid fraction x = 15 wt.%, and solid particle diameter of 1.3 mm. Numerical analysis results are shown in the figure below. Here, turbulent energy k (m2/s2) is the sum of squares of the x, y, and z components of fluctuating velocity u, v, and w. The average value for the relevant pipe cross-section is kav [5, 23, 24].
The upper left figure is the mass solid fraction distribution at the pipe cross section of a
circular pipe with an inner diameter of 15 mm, employing kinetic theory
that considers collisions between the solid particle and the pipe wall,
and among particles. During pseudo-homogeneous flow at high flow velocity,
the phenomenon in which solid particles move towards the pipe center region
is clearly illustrated.
The upper right figures show the streamlines, flow velocities, and flow directions (arrows) associated
with the secondary flow of the second kind of solid particles in an equilateral
triangular pipe with sides of 20 mm and a square pipe with sides of 12
mm. While there is hardly any secondary flow near the pipe center, two
similar-sized vortices are seen at each apex, flowing from the center to
the apex, and then returning to the center after travelling the pipe wall.
Numerical analysis, not shown here, indicates that secondary flows exist
for high-velocity liquid nitrogen and slush nitrogen flows in triangular
and square pipes. The effects of these secondary flows on pressure drop
reduction and heat transfer deterioration are touched upon later.
The lower right figures show the distribution of turbulent energy generating in liquid nitrogen
for a circular pipe with an inner diameter of 15 mm, and a triangular pipe
with sides of 26 mm having the same hydraulic diameter (D = 15 mm) as for the circular pipe. Even though the hydraulic diameter
is the same, the influence of the turbulent energy generating at the apexes
means that the average turbulent energy is greater for the triangular pipe
than for the circular pipe.
The occurrence of pressure drop reduction in the high-velocity flow means
that reduced pumping power can be anticipated in pipeline transport. In
the development of the high-efficiency hydrogen energy system, the use
of pipes with various cross-sectional shapes can be expected for both transport
piping and superconducting power transmission refrigerant piping. The flow
and heat transfer characteristics of slush fluids are thus important in
pipe flow. In comparison to circular pipe having the same hydraulic diameter,
triangular pipe has greater heat transfer surface area and superior integration,
and is therefore also used in applications such as the plate-fin type heat
exchanger.
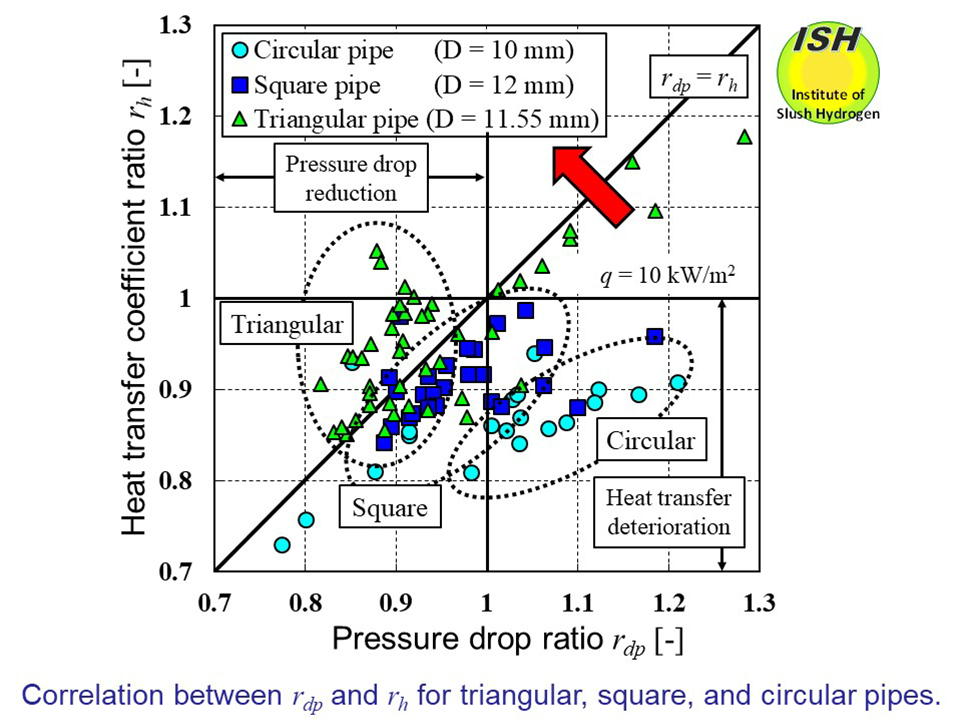
The correlation between the pressure drop ratio (rdp)** and the heat transfer coefficient ratio (rh)*** at the same flow velocity, as experimentally obtained with respect to triangular pipe with sides
of 20 mm (D = 11.55 mm), circular pipe with an inner diameter of 10 mm (D = 10 mm), and square pipe with sides of 12 mm (D = 12 mm), each at the same heat flux (10 kW/m2) is illustrated in the figure below. The hydraulic diameter of each pipe is about the same.
Although the maximum pressure drop reduction and the maximum deterioration
for a circular pipe are greater than those for a triangular pipe as described
before, rh for the triangular pipe tends to be greater than rdp (rh > rdp). The magnitude of average turbulent energy kav for the square pipe, not shown here, is between the values for triangular
and circular pipes, and the figure also shows a similar ordering of properties.
Given that heat transfer deterioration is normally undesirable, the selection
of pipe cross-sectional shape might depend on whether greater emphasis
is being placed on pressure drop or heat transfer in the specific design
of heat transfer piping for slush fluids. For example, in a long-distance pipeline for the exclusive transport
of slush hydrogen, circular pipe characterized by substantial pressure
drop reduction would be suitable from the standpoint of reduced pumping
power. For refrigerant piping in a HTS power transmission system, the pipe
cross-section (circular or rectangular) would be important in terms of
heat transfer properties to prevent quench propagation. Meanwhile, in the
case of heat exchanger, it would be effective from a design perspective
to select triangular flow passage as a cross-sectional shape that would
limit heat transfer deterioration.
In the case of circular pipe, the flow becomes pseudo-homogeneous as the
flow velocity increases, and most of the solid particles shift towards
the pipe center region. In the case of triangular pipe as well, most of
the solid particles are flowing at the pipe center region, where there
is low turbulent energy as indicated in the figure. The presence in the
three apexes of a substantial liquid layer having few solid particles means
that direct interference between the solid particles and the pipe wall
is lessened. As a result, the increase in pressure drop becomes less in
comparison with circular pipe. As indicated in the figure, due to the secondary
flows of the second kind along the pipe wall near the apex, heated liquid
in the pipe wall vicinity is dispersed towards the pipe center, such that
the triangular pipe is considered to promote heat transfer.
In square pipe as well, a tendency like that of triangular pipe can be
seen. Given that the amount of liquid layer at the four apexes is not as
great as in the case of triangular pipe (not shown here), the influence
of the liquid layer is less in the square pipe.
Taking unheated pressure drop test results for circular pipe, square pipe,
and triangular pipe, we applied the least squares approximation method
to obtain a correlation equation between the slush Reynolds number ReSL using the apparent viscosity μSL = μL[1- (x/0.6)]-1.8, and the pipe friction factor λ. Here, μL is liquid nitrogen viscosity. The correlation equations can accurately
estimate the pipe friction factor from the flow velocity and volumetric
solid fraction x (not mass solid fraction) [5, 19, 20].
These correlation equations take pressure drop reduction into account,
and will be effective for design work when estimating required pumping
power for the transport of slush nitrogen.
* PIV method: The velocity of solid particles is directly measured using
the Particle Image Velocimetry method.
** Pressure drop ratio rdp: The ratio of slush nitrogen pressure drop to liquid nitrogen pressure
drop.
*** Heat transfer coefficient ratio rh: The ratio of the heat transfer coefficient for slush nitrogen to that
for liquid nitrogen.
Behavior of solid particles, and correlation between pressure drop reduction and heat transfer deterioration